Reliable Frequency Measurment Using Autocorrelation

Accurate Frequency Detection is important for many projects such as Guitar/Piano Tuners, Vibration Analyzers, Heartrate Monitors, MEMs Sensor Analysis and Laboratory Instruments.

There have been many fine examples of projects that try to solve this problem, for example: Arduino Frequency Detection by amandaghassaei on Instructables and Arduino Frequency Counter Library, but they all use Time Domain techniques; analyzing the signal for features such as : Zero-Crossings, Peak Detection, Slope Detection etc..

Waveforms with very strong harmonic content makes the fundamental frequency undiscernable and signals like that will not be identifiable using Time Domain techniques.

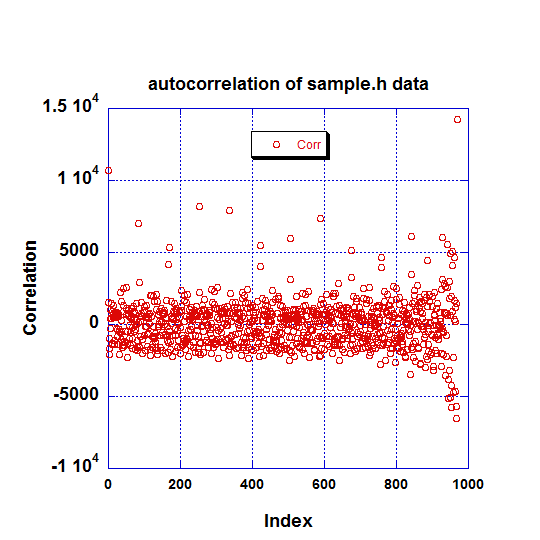
I've written an instructable on how to use Autocorrelation to reliably Identify the frequency of signals in the presence of noise and strong harmonic content.

Actually is surprisingly easy.

Here it is.

Hi Akellyirl,

Nice piece of work, I took the freedom to refactor and optimize your code.

  • created function: float autoCorrelateFrequency(char * sample, int len, float sampleFreq)
  • made datatype signed char, to remove the -128 from inner loop formula
    (preprocess the data array once)
  • removed the division by 256 from the inner loop
  • added endstate!=3 condition in the outer loop to stop processing asap
  • refactor

The above changes improved the performance from 8613 -> 139 millis to determine the 259.41 Hz in the sample signal.
Given that the UNO can make 8000 10bit samples / second it should be possible to determine frequencies up to 2Khz
(4000 samples) in less than a second.

(sample.h file is attached)

//    FILE: frequencyDSP.ino
//  AUTHOR: rob tillaart (org version akellyirl)
// VERSION: 0.1.03
// PURPOSE: frequency analysis using DSP
//    DATE: 2013-10-27
//     URL: http://www.instructables.com/id/Reliable-Frequency-Detection-Using-DSP-Techniques

#include "sample.h"

void setup() 
{
  Serial.begin(115200);
  Serial.println("FrequencyDSP");
  Serial.println("------------");

  uint32_t start = millis();
  float fr = autoCorrelateFrequency(rawData, sizeof(rawData), 22050);
  uint32_t stop = millis();

  Serial.print("freq:\t");
  Serial.println(fr);
  Serial.print("time:\t");
  Serial.println(stop - start);
}

void loop() 
{
}

float autoCorrelateFrequency(char * sample, int len, float sampleFreq)
{
  long sum = 0;
  long sum_old = 0;
  int thresh = 0;
  byte pd_state = 0;
  int period = 0;  // 0 results in inf

  // Autocorrelation
  for (int i=0; i < len && (pd_state != 3); i++)
  {
    sum_old = sum;
    sum = 0;

    for (int k=0; k <len-i; k++)
    {
      sum += (rawData[k]) * (rawData[k+i]);
    }
    sum /= 256;

    // Peak Detect State Machine
    // 0: initial, set threshold
    // 1: detect positive slope
    // 2: detect negative slope
    // 3: peak found
    if (pd_state == 0)
    {
      thresh = sum / 2;
      pd_state = 1;
    } 
    else if (pd_state == 1 && (sum > thresh) && (sum - sum_old) > 0) 
    {
      pd_state = 2;
    }
    else if (pd_state == 2 && (sum - sum_old) <= 0) 
    {
      period = i;
      pd_state = 3;
    } 
  }

  return sampleFreq/period;
}

Please give it a try

sample.h (5.79 KB)

hi,
in the example as input file is used sample.h raw. How would you read samples from an analog input of Arduino?

Thanks

Read some samples on a regular basis, shift them right two bits and store
in the char * that autoCorrelateFrequency () expects?

A problem with the code as posted is that the autocorrelation sum depends on the number of samples correlated, which become smaller as the index (i) increases. That is, the autocorrelation sum is not properly scaled.

I fixed that, and also eliminated the condition that the program stop as soon as it found a large peak. A plot of the results shows a number of large peaks in the autocorrelation function, so the result is less clean than the OP claims. (The plot becomes noisier toward the right end, because the number of samples included in the sum is small and the error increases).

The inner loop now looks like this (should probably divide by (k-1), but that is a minor detail)

    for (k=0; k <len-i; k++)
    {
      sum += (rawData[k]) * (rawData[k+i]);
    }
    sum /= k ;
    fprintf(fp,"%ld\n",sum);

Note: normally the average value of the data points is subtracted from each term, but here, the average is not large (-4).

@jremington
can you post your complete version?

See below. This simplified version is for Code::Blocks on a PC, because I wanted to write out a file of the results for plotting and inspection.

Note: another problem with the original code is that the peak detect algorithm detects only the first peak (not necessarily the largest). I did not bother to fix that.

I know this post is old, and several thousand people have looked at it without commenting, so there probably isn't much interest in the technique.

#include <stdio.h>
#include <stdlib.h>
#include "sample.h"

float autoCorrelateFrequency(char * sample, int len, float sampleFreq)
{
  long sum = 0;
  long sum_old = 0;
  int thresh = 0,i,k;
  char pd_state = 0;
  int period = 0;  // 0 results in inf
    FILE *fp;
    fp=fopen("test.txt", "w");
  // Autocorrelation
  for (i=0; i < len; i++)
  {
    fprintf(fp,"%d,%d,",i,rawData[i]);
    sum_old = sum;
    sum = 0;

    for (k=0; k <len-i; k++)
    {
      sum += (rawData[k]) * (rawData[k+i]);
    }
    sum /= k ;  //this should be k-1, but if so the last point will result in divide by zero
    fprintf(fp,"%ld\n",sum);
    // Peak Detect State Machine
    // 0: initial, set threshold
    // 1: detect positive slope
    // 2: detect negative slope
    // 3: peak found
    if (pd_state == 0)
    {
      thresh = sum / 2;
      pd_state = 1;
    }
    else if (pd_state == 1 && (sum > thresh) && (sum - sum_old) > 0)
    {
      pd_state = 2;
    }
    else if (pd_state == 2 && (sum - sum_old) <= 0)
    {
      period = i;
      pd_state = 3;
    }
  }
    fclose(fp);
  return sampleFreq/period;
}

int main()
{
  float fr = autoCorrelateFrequency(rawData, sizeof(rawData), 22050);

  printf("freq: %f\n",fr);

    return 0;
}

hi,
something is wrong:
I have compiled the code of robtillaart, I used sample.h of instructables where I added a global variable
const float sample_freq = 22050.0;
(so every sample.h can have different sample rate)

I get the freq = 5512.5Hz result, but the frequency of instructables sample.h is 260Hz (with their code I get 259.4Hz)

With the source code of jremington I get the same result.

What am I doing wrong?

frequencyDSP_robtillaart.c (1.55 KB)

sample.h (5.93 KB)

please post the output of the sketch you attached.

which board are you using?

The output is:

samples: 970, sample_freq: 22050.000000
freq: 5512.500000

I've compiled on XP as
gcc frequencyDSP_robtillaart.c -o frequencyDSP_robtillaart.exe

And I have compiled in Linux Mint 17 as

gcc frequencyDSP_robtillaart.c -o frequencyDSP_robtillaart

The output is the same in both cases.

With this other instructables code the output is ok:

len: 970 sample_rate: 22050.000000
freq: 259.411774

frequencyDSP_instructables.c (885 Bytes)

could be related to size of datatypes? 32 bit - 16 bit

Guys. This is great work.
I would suggest that the next step would be..
Having found the dominant frequency, subtract it from the raw data. Then go through the whole process again to find the next most dominant frequency.
This can be repeated until the rawdata minus all of the frequencies found = 0. That would be a really interesting toy. Possibly even able to identify someone by their voice.

Just for completeness, I calculated the Fourier transform (as an FFT of length 1024, zero padded) on the original data, and the output is shown on the attached plot.

As you can see, the autocorrelation function does quite a bit better than the FFT to distinguish the frequency of interest, but there are other peaks in the autocorrelation function nearly as large, so it would be difficult to have much confidence in the result.

I think you may have a problem with your code. You have defined rawData to be an array of type char. When you perform the multiplication in the step which multiplies the two rawData values you are overflowing the type char. The multiplication is done on type char before it is assigned to variable sum.

    for (k=0; k <len-i; k++)
    {
      sum += (rawData[k]) * (rawData[k+i]);
    }

I have been bitten by this before. Try casting rawData to long before doing the multiplication and see if you get the same answer.

I analyzed your data in Mathematica and got a much different result for the autocorrelation. Also, you imply that autocorrelation is a frequency domain technique which it is not. It is done strictly in the time domain. Taking the FFT of the autocorrelation gives the power spectrum of the signal putting it in the frequency domain.

The plot below is the periodogram of the data. Mathematica has a function to find the peaks which are found at the following indices of the data (shown as red dots on the plot)...
{13, 24, 35, 47, 59, 70, 82, 93, 105, 116, 128, 139, 151, 162, 174,
185, 197, 208, 220, 231, 243, 254, 266, 277, 289, 300, 312, 323, 335,
346, 358, 369, 381, 392, 404, 415, 427, 438, 450, 461, 472, 485, 487,
500, 511, 522, 534, 545, 557, 568, 580, 591, 603, 614, 626, 637, 649,
660, 672, 683, 695, 706, 718, 729, 741, 752, 764, 775, 787, 798, 810,
821, 833, 844, 856, 867, 879, 890, 902, 913, 925, 937, 948, 959}

The fundamental frequency (259.09 Hz)and overtones really stand out when displayed this way.

powerspectrum.png

Not my code, but you have a point. It is certainly easy to overlook those traps in someone else's!

Curiously, using Code::Blocks/gcc on the PC as I was, it does not make any difference to the overall result to cast rawData[] as long, i.e. sum += ( (long) rawData[k]) * ( (long) rawData[k+i]);
It appears that on the PC, Code::Blocks promotes the type char to a larger integer for the purpose of the multiplication. I haven't yet figured out how to view the machine code listing to check this supposition, so I printed out the first few values of rawData[]*rawData[] using the following statement:    fprintf(fp,"%d,%d,%d\n",i,rawData[i],rawData[i]*rawData[i]);and got the following values:

0,115,13225
1,126,15876
2,62,3844
3,57,3249
4,-80,6400
5,77,5929

Clearly, the multiplication is not overflowing the char data type. So, I don't see why Matlab would give a "much different result" for the autocorrelation function (why not show us what it is?).

I checked the operations performed by Matlab and found that the built-in function autocorr() calculates the same unweighted function that the OP originally described (except that the mean value of the data is properly subtracted). This is fine for short lags but reduces the weight of peaks associated with large lags. From the autocorr help message "the form adopted here follows that of Box, Jenkins, and Reinsel ... Time Series Analysis: Forecasting and Control. 3rd ed. Upper Saddle River, NJ: Prentice-Hall, 1994". I've attached a sample plot obtained by using the following Matlab script:

m=csvread('test.txt');
ACF=autocorr(m(:,2),969);
plot(ACF);

One can see how the peaks diminish as the lag increases, which I consider to be misleading. The Fourier transform of this particular autocorrelation function will not be the same as the power spectrum plot of the zero-filled FFT that I posted earlier.

Hello!

I've tested the code of robtillaart but i'm getting some weird characters on the serial monitor. Any idea why is this happening?

No, with so little information ...

I'm using the Uno board. I have uploaded the following code...

#include "sample.h"

void setup() 
{
  Serial.begin(115200);
  Serial.println("FrequencyDSP");
  Serial.println("------------");

  uint32_t start = millis();
  float fr = autoCorrelateFrequency(rawData, sizeof(rawData), 22050);
  uint32_t stop = millis();

  Serial.print("freq:\t");
  Serial.println(fr);
  Serial.print("time:\t");
  Serial.println(stop - start);
}

void loop() 
{
}

float autoCorrelateFrequency(char * sample, int len, float sampleFreq)
{
  long sum = 0;
  long sum_old = 0;
  int thresh = 0;
  byte pd_state = 0;
  int period = 0;  // 0 results in inf

  // Autocorrelation
  for (int i=0; i < len && (pd_state != 3); i++)
  {
    sum_old = sum;
    sum = 0;

    for (int k=0; k <len-i; k++)
    {
      sum += (rawData[k]) * (rawData[k+i]);
    }
    sum /= 256;

    // Peak Detect State Machine
    // 0: initial, set threshold
    // 1: detect positive slope
    // 2: detect negative slope
    // 3: peak found
    if (pd_state == 0)
    {
      thresh = sum / 2;
      pd_state = 1;
    } 
    else if (pd_state == 1 && (sum > thresh) && (sum - sum_old) > 0) 
    {
      pd_state = 2;
    }
    else if (pd_state == 2 && (sum - sum_old) <= 0) 
    {
      period = i;
      pd_state = 3;
    } 
  }

  return sampleFreq/period;
}

but instead of a frequency what i'm getting on the serial monitor is this


üÕ&
K±μ
Yþ)¤

Sorry i'm not an experienced arduino user not sure what else i should provide.

sample.h (5.79 KB)