Et on termine par le code d'affichage :
<?php
//Connexion a la base de données
// Remplacez localhost, highcharts, username, password, par vos informations de connexion.
$hostname = "localhost";
$database = "ici le nom de la BDD";
$username = "ici le login bdd";
$password = "ici le pasword BDD";
$Conn = mysql_pconnect($hostname, $username, $password);
?>
<html>
<head>
<title>Falaf.net - Highstock Exemple 2</title>
<!-- Chargement des librairies: Jquery & highcharts -->
<script type="text/javascript" src="http://ajax.googleapis.com/ajax/libs/jquery/1.8.2/jquery.min.js"></script>
<script type="text/javascript" src="js/highstock.js" ></script>
<script type="text/javascript" src="js/themes/gray.js" ></script>
<script type="text/javascript" src="js/modules/exporting.js" ></script>
<!-- Chargement des traductions -->
<script type="text/javascript" src="js/options.js"></script>
<!-- Chargement des variables, et paramètres de Highcharts -->
<script type="text/javascript">
$(function() {
// Ici commence le code pour le premier graphique
// Ce graphique à pour nom: container_chart_un
$('#container_chart_un').highcharts('StockChart', {
rangeSelector : {
buttons: [
{type: 'day',count: 1,text: '1j'},
{type: 'day',count: 3,text: '3j'},
{type: 'day',count: 7,text: '7j'},
{type: 'month',count: 1,text: '1m'},
{type: 'year',count: 1,text: '1a'},
{type: 'all',text: 'Tout'}],
selected : 5
},
legend:
{
verticalAlign: 'top',
floating : false,
y: 25,
enabled: true
},
yAxis: {
title: {
text: 'temperature (°)'
}
},
tooltip: {
shared: true,
//Ajout d'une unité de mesure lors du survole d'un point du graphique
valueSuffix: ' °'
},
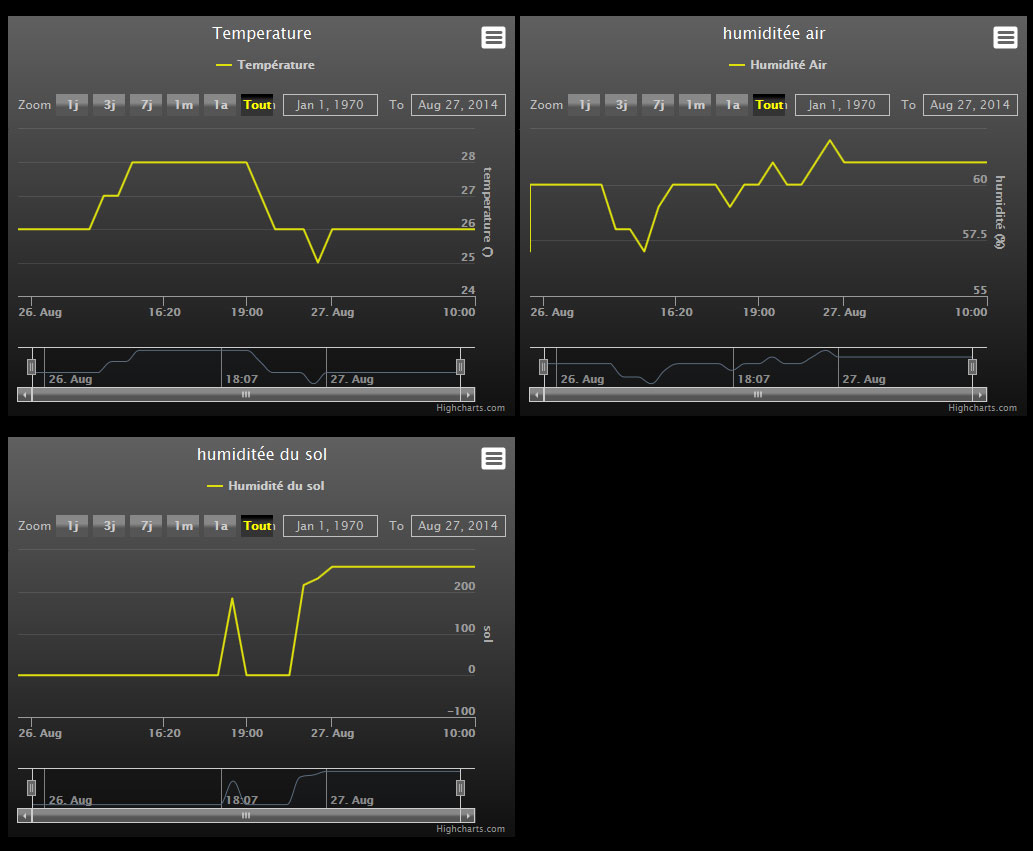
title : {
text : 'Temperature'
},
series: [
<?php
mysql_select_db($database, $Conn);
// Dans la ligne ci-dessous, modifiez sonde_1, par le nom de votre première sonde
$query_info = "SELECT ftimestamp, temperature FROM `graph_tbl` WHERE `nomCapteur` LIKE 'sns0' ORDER BY ftimestamp ASC";
$info = mysql_query($query_info, $Conn);
$row_info = mysql_fetch_assoc($info);
$totalRows_info = mysql_num_rows($info);
?>
{
// Dans la ligne ci-dessous, modifiez name, par le nom de votre courbe. (Exemple: Température, pression, etc.)
name: 'Température',
data: [<?php do { ?>
[Date.UTC(<?php echo date("Y", strtotime("".$row_info['ftimestamp'])).", ".(date("m", strtotime("".$row_info['ftimestamp'])) - 1).", ".date("d, H, i", strtotime("".$row_info['ftimestamp'])); ?>), <?php echo $row_info['temperature']; ?>],
<?php } while ($row_info = mysql_fetch_assoc($info)); ?>],
},
]
});
//Ici se termine le code pour le premier graphique
// Ici commence le code pour le second graphique
// Ce second graphique à pour nom: container_chart_deux
$('#container_chart_deux').highcharts('StockChart', {
rangeSelector : {
buttons: [
{type: 'day',count: 1,text: '1j'},
{type: 'day',count: 3,text: '3j'},
{type: 'day',count: 7,text: '7j'},
{type: 'month',count: 1,text: '1m'},
{type: 'year',count: 1,text: '1a'},
{type: 'all',text: 'Tout'}],
selected : 5
},
legend:
{
verticalAlign: 'top',
floating : false,
y: 25,
enabled: true
},
yAxis: {
title: {
text: 'humidité (%)'
}
},
tooltip: {
shared: true,
//Ajout d'une unité de mesure lors du survole d'un point du graphique
valueSuffix: ' %'
},
title : {
text : 'humiditée air'
},
series: [
<?php
mysql_select_db($database, $Conn);
// Dans la ligne ci-dessous, modifiez sonde_2, par le nom de votre deuxième sonde
$query_info = "SELECT ftimestamp, humidity FROM `graph_tbl` WHERE `nomCapteur` LIKE 'sns0' ORDER BY ftimestamp ASC";
$info = mysql_query($query_info, $Conn);
$row_info = mysql_fetch_assoc($info);
$totalRows_info = mysql_num_rows($info);
?>
{
// Dans la ligne ci-dessous, modifiez name, par le nom de votre courbe. (Exemple: Température, pression, etc.)
name: 'Humidité Air',
data: [<?php do { ?>
[Date.UTC(<?php echo date("Y", strtotime("".$row_info['ftimestamp'])).", ".(date("m", strtotime("".$row_info['ftimestamp'])) - 1).", ".date("d, H, i", strtotime("".$row_info['ftimestamp'])); ?>), <?php echo $row_info['humidity']; ?>],
<?php } while ($row_info = mysql_fetch_assoc($info)); ?>],
},]
});
//Ici se termine le code pour le second graphique
//Ajoutez ici le code pour les nouveaux graphiques
// Ici commence le code pour le second graphique
// Ce second graphique à pour nom: container_chart_trois
$('#container_chart_trois').highcharts('StockChart', {
rangeSelector : {
buttons: [
{type: 'day',count: 1,text: '1j'},
{type: 'day',count: 3,text: '3j'},
{type: 'day',count: 7,text: '7j'},
{type: 'month',count: 1,text: '1m'},
{type: 'year',count: 1,text: '1a'},
{type: 'all',text: 'Tout'}],
selected : 5
},
legend:
{
verticalAlign: 'top',
floating : false,
y: 25,
enabled: true
},
yAxis: {
title: {
text: 'sol '
}
},
tooltip: {
shared: true,
//Ajout d'une unité de mesure lors du survole d'un point du graphique
valueSuffix: ' /1024'
},
title : {
text : 'humiditée du sol'
},
series: [
<?php
mysql_select_db($database, $Conn);
// Dans la ligne ci-dessous, modifiez sonde_2, par le nom de votre deuxième sonde
$query_info = "SELECT ftimestamp, sol FROM `graph_tbl` WHERE `nomCapteur` LIKE 'sns0' ORDER BY ftimestamp ASC";
$info = mysql_query($query_info, $Conn);
$row_info = mysql_fetch_assoc($info);
$totalRows_info = mysql_num_rows($info);
?>
{
// Dans la ligne ci-dessous, modifiez name, par le nom de votre courbe. (Exemple: Température, pression, etc.)
name: 'Humidité du sol',
data: [<?php do { ?>
[Date.UTC(<?php echo date("Y", strtotime("".$row_info['ftimestamp'])).", ".(date("m", strtotime("".$row_info['ftimestamp'])) - 1).", ".date("d, H, i", strtotime("".$row_info['ftimestamp'])); ?>), <?php echo $row_info['sol']; ?>],
<?php } while ($row_info = mysql_fetch_assoc($info)); ?>],
},]
});
//Ici se termine le code pour le second graphique
// Fin du code pour Highstock
});
</script>
</head>
<body style="background:#000;">
<p></p>
<p>
<!-- Affichage des graphiques -->
<div id="container_chart_un" class="Tableau"></div>
<div id="container_chart_deux" class="Tableau"></div>
<div id="container_chart_trois" class="Tableau"></div></p>
<div align="center">
<p><a href="http://www.falaf.net">© Falaf.net</a></p>
</div>
<style>
body {background:#000;}
.Tableau
{width:49%; height:400px; display:inline-block; margin-bottom:2%
}
</style>
</body>
</html>