Reading ADC and plotting graph on LCD

Hello,

I want to plot a graph of a pressure on an LCD Screen(Elegoo 2.8” TFT). The pressure is calculated from a Voltage reading I get from an ADC ( ADS1115). The equation for the pressure is: pressure = 10^(Voltage-5.5).

I tried it with a 16x2 LCD and it worked fine. The code I used there was:

#include <Adafruit_ADS1X15.h>
Adafruit_ADS1115 ads;     
#include <LiquidCrystal.h>
int rs=7;
int en=8;
int d4=9;
int d5=10;
int d6=11;
int d7=12;
LiquidCrystal lcd(rs,en,d4,d5,d6,d7);
float truevoltage;
float pressure_mbar;
void setup(void)
{
  Serial.begin(9600);
  Serial.println("Hello!");

  Serial.println("Getting single-ended readings from AIN0..3");
  Serial.println("ADC Range: +/- 6.144V (1 bit = 3mV/ADS1015, 0.1875mV/ADS1115)");
lcd.begin(16,2);
  // The ADC input range (or gain) can be changed via the following
  // functions, but be careful never to exceed VDD +0.3V max, or to
  // exceed the upper and lower limits if you adjust the input range!
  // Setting these values incorrectly may destroy your ADC!
  //                                                                ADS1015  ADS1115
  //                                                                -------  -------
  // ads.setGain(GAIN_TWOTHIRDS);  // 2/3x gain +/- 6.144V  1 bit = 3mV      0.1875mV (default)
  // ads.setGain(GAIN_ONE);        // 1x gain   +/- 4.096V  1 bit = 2mV      0.125mV
  // ads.setGain(GAIN_TWO);        // 2x gain   +/- 2.048V  1 bit = 1mV      0.0625mV
  // ads.setGain(GAIN_FOUR);       // 4x gain   +/- 1.024V  1 bit = 0.5mV    0.03125mV
  // ads.setGain(GAIN_EIGHT);      // 8x gain   +/- 0.512V  1 bit = 0.25mV   0.015625mV
  // ads.setGain(GAIN_SIXTEEN);    // 16x gain  +/- 0.256V  1 bit = 0.125mV  0.0078125mV
ads.setGain(GAIN_TWOTHIRDS);
  if (!ads.begin()) {
    Serial.println("Failed to initialize ADS.");
    while (1);
  }
}

void loop(void)
{
int16_t adc0, adc1, adc2, adc3;
float volts0, volts1, volts2, volts3;
float truepressure;
adc0 = ads.readADC_SingleEnded(0);
volts0 = ads.computeVolts(adc0);


truevoltage=volts0*2;
  
lcd.setCursor(8,0);
lcd.print("mbar");
lcd.setCursor(0,0);
pressure_mbar=pow(10,(truevoltage-5.5));
Serial.println(pressure_mbar);
lcd.print(pressure_mbar);
delay(500);
lcd.clear();
  }

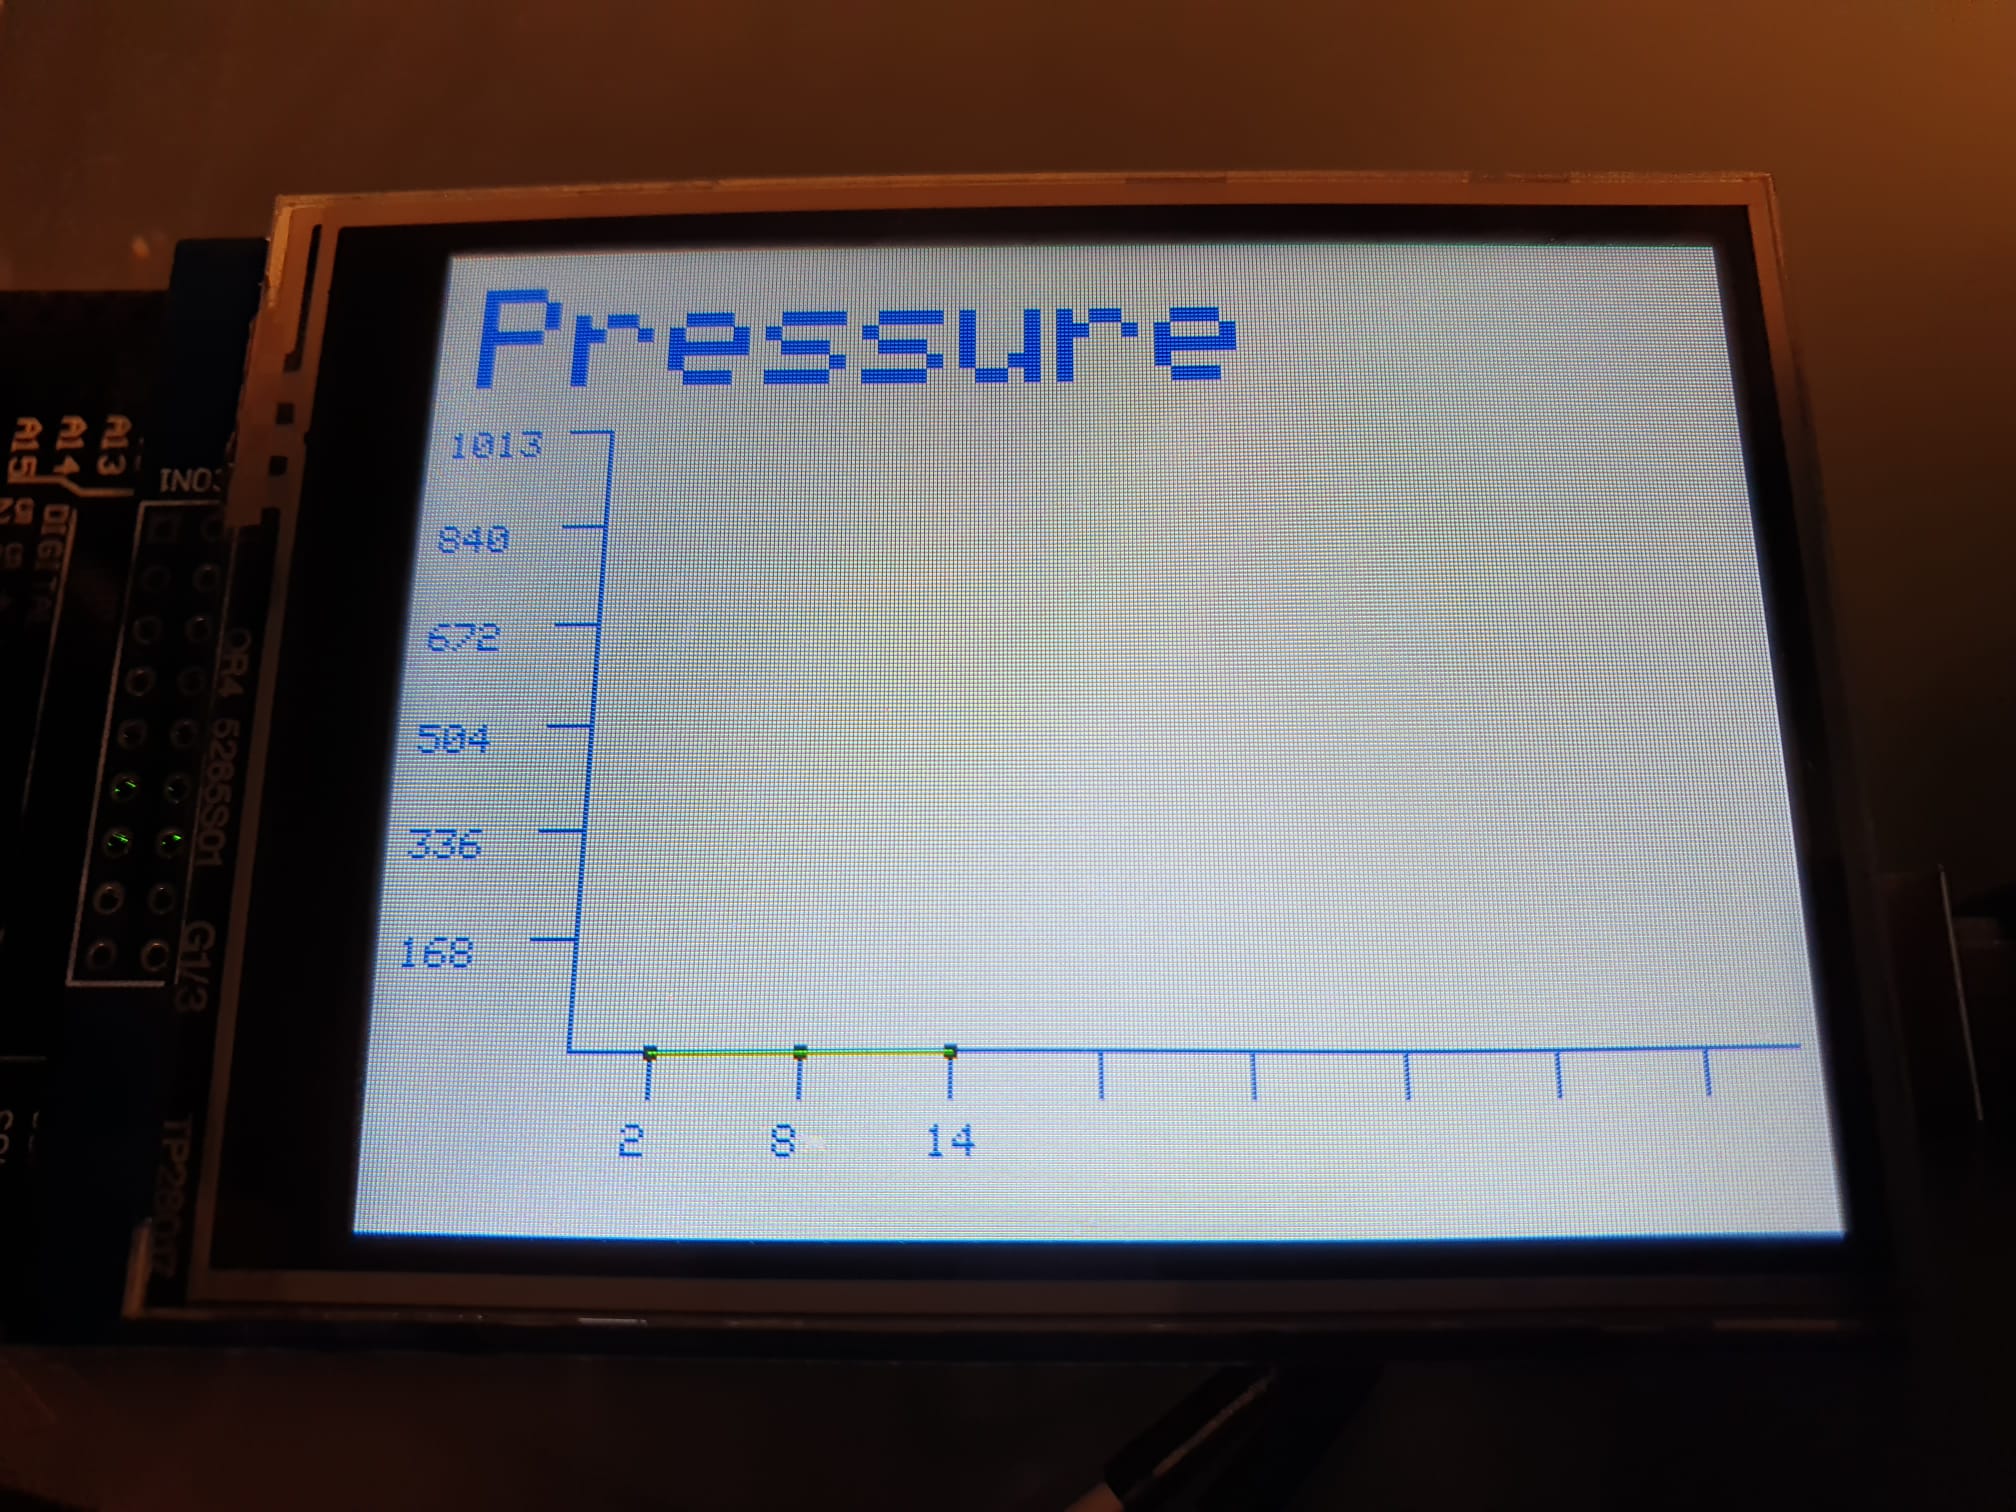
I looked around the internet and found this website: https://create.arduino.cc/projecthub/andreiflorian/tft-graphing-live-history-graphs-744f3b
I copied the code and used the guide on the site to change the scale of the graph. The website says to change the code under "void graph()". I did that and it works if i write a number for "pressure_mbar".

void graph()
{

pressure_mbar=1000;

  //chk = DHT.read11(22);
  temp = pressure_mbar;
  timeBlock[valuePos] = ((millis() - 4500) / 1000);

  valueBlock[valuePos] = temp;
  
  if(proDebug)
  {
    Serial.println(timeBlock[valuePos]);
  }
  
  if(blockPos < 8)
  {
    // print the time
    tft.setCursor((mark[valuePos] - 5), (originY + 16));
    tft.setTextColor(graphColor, WHITE);
    tft.setTextSize(1);
    tft.println(timeBlock[valuePos]);
    
    // map the value
    locationBlock[valuePos] = map(temp, 0, graphRange, originY, (originY - sizeY));

    // draw point
    tft.fillRect((mark[valuePos] - 1), (locationBlock[valuePos] - 1), markSize, markSize, pointColor);

    // try connecting to previous point
    if(valuePos != 0)
    {
      tft.drawLine(mark[valuePos], locationBlock[valuePos], mark[(valuePos - 1)], locationBlock[(valuePos - 1)], lineColor);
    }

    blockPos++;
  }
  else
  {
    // clear the graph's canvas
    tft.fillRect((originX + 2), (originY - sizeY), sizeX, sizeY, WHITE);

    // map the value - current point
    locationBlock[valuePos] = map(temp, 0, graphRange, originY, (originY - sizeY));

    // draw point - current point
    tft.fillRect((mark[7]), (locationBlock[valuePos] - 1), markSize, markSize, pointColor);

    // draw all points
    for(int i = 0; i < 8; i++)
    {
      tft.fillRect((mark[(blockPos - (i + 1))] - 1), (locationBlock[(valuePos - i)] - 1), markSize, markSize, pointColor);
    }

    // draw all the lines
    for(int i = 0; i < 7; i++)
    {
      tft.drawLine(mark[blockPos - (i + 1)], locationBlock[valuePos - i], mark[blockPos - (i + 2)], locationBlock[valuePos - (i + 1)], lineColor);
    }
    
    // change time lables
    for(int i = 0; i <= 7; i++)
    {
      tft.setCursor((mark[(7 - i)] - 5), (originY + 16));
      tft.setTextColor(graphColor, WHITE);
      tft.setTextSize(1);
      tft.println(timeBlock[valuePos - i]);
    }
  }

  valuePos++;
}

But as soon as i try to read out the ADC, it does not work anymore. I dont get a error message but the Graph does not plot any values.
What am i doing wrong?

This is the code with the lines to read out the ADC and convert the Voltage to a pressure:

void graph()
{
int16_t adc0, adc1, adc2, adc3;
float volts0, volts1, volts2, volts3;
float truepressure;
adc0 = ads.readADC_SingleEnded(0);
volts0 = ads.computeVolts(adc0);
truevoltage=volts0*2; //Voltage times two to compensate for the Voltage divider

pressure_mbar=pow(10,(truevoltage-5.5));


  //chk = DHT.read11(22);
  temp = pressure_mbar;
  timeBlock[valuePos] = ((millis() - 4500) / 1000);

  valueBlock[valuePos] = temp;
  
  if(proDebug)
  {
    Serial.println(timeBlock[valuePos]);
  }
  
  if(blockPos < 8)
  {
    // print the time
    tft.setCursor((mark[valuePos] - 5), (originY + 16));
    tft.setTextColor(graphColor, WHITE);
    tft.setTextSize(1);
    tft.println(timeBlock[valuePos]);
    
    // map the value
    locationBlock[valuePos] = map(temp, 0, graphRange, originY, (originY - sizeY));

    // draw point
    tft.fillRect((mark[valuePos] - 1), (locationBlock[valuePos] - 1), markSize, markSize, pointColor);

    // try connecting to previous point
    if(valuePos != 0)
    {
      tft.drawLine(mark[valuePos], locationBlock[valuePos], mark[(valuePos - 1)], locationBlock[(valuePos - 1)], lineColor);
    }

    blockPos++;
  }
  else
  {
    // clear the graph's canvas
    tft.fillRect((originX + 2), (originY - sizeY), sizeX, sizeY, WHITE);

    // map the value - current point
    locationBlock[valuePos] = map(temp, 0, graphRange, originY, (originY - sizeY));

    // draw point - current point
    tft.fillRect((mark[7]), (locationBlock[valuePos] - 1), markSize, markSize, pointColor);

    // draw all points
    for(int i = 0; i < 8; i++)
    {
      tft.fillRect((mark[(blockPos - (i + 1))] - 1), (locationBlock[(valuePos - i)] - 1), markSize, markSize, pointColor);
    }

    // draw all the lines
    for(int i = 0; i < 7; i++)
    {
      tft.drawLine(mark[blockPos - (i + 1)], locationBlock[valuePos - i], mark[blockPos - (i + 2)], locationBlock[valuePos - (i + 1)], lineColor);
    }
    
    // change time lables
    for(int i = 0; i <= 7; i++)
    {
      tft.setCursor((mark[(7 - i)] - 5), (originY + 16));
      tft.setTextColor(graphColor, WHITE);
      tft.setTextSize(1);
      tft.println(timeBlock[valuePos - i]);
    }
  }

  valuePos++;
}

What am i doing wrong? Thank you alot for your help!

So what does it do ? Is the value you are trying to plot zero by any chance ? What do you see if you print the raw ADC value and any intermediate values of the calculation to the Serial monitor and do they look reasonable ?

No, i tried different voltages, that show a pressure of around 1000 mbar if i run the Code isolated. Even if the value is zero, i would be able to see the Graph plotting this value in 6 s intervals.

If i run the code(with the graph) with the lines for the ADC the Graph does not show zero.
It does not even count up in 6 s intervals (as it does, when i just write a value for the pressure). It looks like it froze.

If i use the Serial.print (pressure_mbar) command or the Serial.print (volts0) command, i don't get anything on the serial monitor.
This is what it looks like, if the pressure is 0:

And this is what it looks like, if i try to run it with the code for the ADC:

Thank you!

Strong hint: If you want help with code, post ALL of it. The snippets are useless.

You won't be able to debug the code until you fix that problem, which is completely unrelated to plotting.

The real problem is that you copied someone else's plotting code, and modified it without understanding how it works.

A much better approach is to start with a very simple example that plots a few things on the TFT screen, and make sure that you understand what every single line of code does before jumping in to a large application.

Thank you for the hint. This is the complete Code:

// Universum | Universum Projects > TFTHistoryGraph

// Andrei Florian 14/JUN/2018

#include <Elegoo_GFX.h>    // Core graphics library
#include <Elegoo_TFTLCD.h> // Hardware-specific library
#include <Universum_TFTColours.h> // Universum library for colours
#include <Adafruit_ADS1X15.h>
Adafruit_ADS1115 ads;    

#define LCD_CS A3 // Chip Select goes to Analog 3
#define LCD_CD A2 // Command/Data goes to Analog 2
#define LCD_WR A1 // LCD Write goes to Analog 1
#define LCD_RD A0 // LCD Read goes to Analog 0
#define LCD_RESET A4 // Can alternately just connect to Arduino's reset pin


Elegoo_TFTLCD tft(LCD_CS, LCD_CD, LCD_WR, LCD_RD, LCD_RESET);

//variables Voltage Pressure
float truevoltage;
float pressure_mbar;
float volt0;
int16_t adc0, adc1, adc2, adc3;
float volts0, volts1, volts2, volts3;
float truepressure;

// Global variables
  int valueBlock[500];
  int timeBlock[500];
  int locationBlock[500];
  int valuePos;
  int blockPos;
  int temp;
  int chk;

  
// Editable Variables
  bool proDebug = 0;

  uint16_t graphColor = BLUE;
  uint16_t pointColor = BLACK;
  uint16_t lineColor = GREEN;

  String graphName = "Pressure";

  int graphRange = 1013;
  int markSize = 3;
  
// Calculate Values
  const int numberOfMarks = 8;
  const int originX = 45;
  const int originY = 200;
  const int sizeX = 270;
  const int sizeY = 150;
  const int deviation = 30;
  
  int boxSize = (sizeX / numberOfMarks);
  int mark[] = {(boxSize + deviation), ((boxSize * 2) + deviation), ((boxSize * 3) + deviation), ((boxSize * 4) + deviation), ((boxSize * 5) + deviation), ((boxSize * 6) + deviation), ((boxSize * 7) + deviation), ((boxSize * 8) + deviation)};

  const int minorSizeY = (originY + 10);
  const int minorSizeX = (originX - 10);

  int numberSize = (sizeY / 6);
  int number[] = {numberSize, (numberSize * 2), (numberSize * 3), (numberSize * 4), (numberSize * 5), (numberSize * 6)};

  int numberValue = (graphRange / 6);
  int val[] = {graphRange, (numberValue * 5), (numberValue * 4), (numberValue * 3), (numberValue * 2), numberValue};

void drawHome()
{
  tft.setCursor(10, 10); // set the cursor
  tft.setTextColor(BLUE); // set the colour of the text
  tft.setTextSize(5); // set the size of the text
  tft.println("Vakuummeter");
 
  delay(4000);

  tft.fillScreen(WHITE);
  delay(500);
}


void drawGraph()
{

  // draw title
  tft.setCursor(10, 10); // set the cursor
  tft.setTextColor(BLUE); // set the colour of the text
  tft.setTextSize(4); // set the size of the text
  tft.println(graphName);
  
  // draw outline
  tft.drawLine(originX, originY, (originX + sizeX), originY, graphColor);
  tft.drawLine(originX, originY, originX, (originY - sizeY), graphColor);

  // draw lables
  for(int i = 0; i < numberOfMarks; i++)
  {
    tft.drawLine(mark[i], originY, mark[i], minorSizeY, graphColor);
  }

  // draw numbers
  for(int i = 0; i < 6; i++)
  {
    tft.drawLine(originX, (originY - number[i]), minorSizeX, (originY - number[i]), graphColor);
  }

  // draw number values
  for(int i = 0; i < 6; i++)
  {
    tft.setCursor((minorSizeX - 30), (number[i] + numberSize));
    tft.setTextColor(graphColor);
    tft.setTextSize(1);
    tft.println(val[i]);
  }
  
}


void graph()
{
int16_t adc0, adc1, adc2, adc3;
float volts0, volts1, volts2, volts3;
float truepressure;
adc0 = ads.readADC_SingleEnded(0);
volts0 = ads.computeVolts(adc0);
truevoltage=volts0*2; 
pressure_mbar=pow(10,(truevoltage-5.5));
Serial.print (pressure_mbar);

 
  timeBlock[valuePos] = ((millis() - 4500) / 1000);
  valueBlock[valuePos] = pressure_mbar;
  
  
  if(blockPos < 8)
  {
    // print the time
    tft.setCursor((mark[valuePos] - 5), (originY + 16));
    tft.setTextColor(graphColor, WHITE);
    tft.setTextSize(1);
    tft.println(timeBlock[valuePos]);
    
    // map the value
    locationBlock[valuePos] = map(pressure_mbar, 0, graphRange, originY, (originY - sizeY));

    // draw point
    tft.fillRect((mark[valuePos] - 1), (locationBlock[valuePos] - 1), markSize, markSize, pointColor);

    // try connecting to previous point
    if(valuePos != 0)
    {
      tft.drawLine(mark[valuePos], locationBlock[valuePos], mark[(valuePos - 1)], locationBlock[(valuePos - 1)], lineColor);
    }

    blockPos++;
  }
  else
  {
    // clear the graph's canvas
    tft.fillRect((originX + 2), (originY - sizeY), sizeX, sizeY, WHITE);

    // map the value - current point
    locationBlock[valuePos] = map(pressure_mbar, 0, graphRange, originY, (originY - sizeY));

    // draw point - current point
    tft.fillRect((mark[7]), (locationBlock[valuePos] - 1), markSize, markSize, pointColor);

    // draw all points
    for(int i = 0; i < 8; i++)
    {
      tft.fillRect((mark[(blockPos - (i + 1))] - 1), (locationBlock[(valuePos - i)] - 1), markSize, markSize, pointColor);
    }

    // draw all the lines
    for(int i = 0; i < 7; i++)
    {
      tft.drawLine(mark[blockPos - (i + 1)], locationBlock[valuePos - i], mark[blockPos - (i + 2)], locationBlock[valuePos - (i + 1)], lineColor);
    }
    
    // change time lables
    for(int i = 0; i <= 7; i++)
    {
      tft.setCursor((mark[(7 - i)] - 5), (originY + 16));
      tft.setTextColor(graphColor, WHITE);
      tft.setTextSize(1);
      tft.println(timeBlock[valuePos - i]);
    }
  }

  valuePos++;
}


void setup()
{
  if(proDebug)
  {
    Serial.begin(9600);
    while(!Serial) {};
  }
  
  tft.reset();
  delay(500);
  uint16_t identifier = tft.readID();
  identifier=0x9341;

  tft.begin(identifier);
  tft.setRotation(1);
  
 
  drawHome();
  drawGraph();
  
}

void loop()
{
 graph();
  delay(6000);
}

If your 'proDebug' variable is set to true you will get serial output.

You might want to bring your baud rate into the modern world...

Serial.begin(115200);

I tried setting the 'proDebug' variable to 1. Still nothing on the serial monitor...
I also changed the baud rate as you suggested.

I also get this error message, but i get the same message with the code that works:


In file included from C:\Users\nikla\Desktop\Druckmessung Graph\Test1\Test1.ino:7:0:
C:\Users\nikla\Documents\Arduino\libraries\TFTHistoryGraph/Universum_TFTColours.h:19:0: warning: "PINK" redefined
 #define PINK            0xF81F
 
In file included from c:\program files (x86)\arduino\hardware\tools\avr\avr\include\avr\iom2560.h:38:0,
                 from c:\program files (x86)\arduino\hardware\tools\avr\avr\include\avr\io.h:174,
                 from c:\program files (x86)\arduino\hardware\tools\avr\avr\include\avr\pgmspace.h:90,
                 from C:\Program Files (x86)\Arduino\hardware\arduino\avr\cores\arduino/Arduino.h:28,
                 from sketch\Test1.ino.cpp:1:
c:\program files (x86)\arduino\hardware\tools\avr\avr\include\avr\iomxx0_1.h:1149:0: note: this is the location of the previous definition
 # define PINK   _SFR_MEM8(0x106)
 
In file included from C:\Users\nikla\Documents\Arduino\libraries\Elegoo_TFTLCD\Elegoo_TFTLCD.cpp:19:0:
C:\Users\nikla\Documents\Arduino\libraries\Elegoo_TFTLCD\pin_magic.h:166:28: warning: backslash and newline separated by space
   #define write8inline(d) {\
                             
C:\Users\nikla\Documents\Arduino\libraries\Elegoo_TFTLCD\pin_magic.h:172:30: warning: backslash and newline separated by space
    PORTG |= (d & 0x10) << 1; \
                               
C:\Users\nikla\Documents\Arduino\libraries\Elegoo_TFTLCD\pin_magic.h:287:33: warning: backslash and newline separated by space
   #define read8inline(result) { \
                                  
C:\Users\nikla\Documents\Arduino\libraries\Elegoo_TFTLCD\Elegoo_TFTLCD.cpp:872:0: warning: "read8" redefined
   #define read8(x) x=read8fn()
 
In file included from C:\Users\nikla\Documents\Arduino\libraries\Elegoo_TFTLCD\Elegoo_TFTLCD.cpp:19:0:
C:\Users\nikla\Documents\Arduino\libraries\Elegoo_TFTLCD\pin_magic.h:188:0: note: this is the location of the previous definition
   #define read8             read8inline
 
C:\Users\nikla\Documents\Arduino\libraries\Elegoo_TFTLCD\Elegoo_TFTLCD.cpp: In member function 'void Elegoo_TFTLCD::begin(uint16_t)':
C:\Users\nikla\Documents\Arduino\libraries\Elegoo_TFTLCD\pin_magic.h:406:25: warning: large integer implicitly truncated to unsigned type [-Woverflow]
   hi = (d) >> 8; lo = (d); CD_DATA   ; write8(hi); write8(lo); }
                         ^
C:\Users\nikla\Documents\Arduino\libraries\Elegoo_TFTLCD\pin_magic.h:192:29: note: in expansion of macro 'writeRegister16inline'
   #define writeRegister16   writeRegister16inline
                             ^~~~~~~~~~~~~~~~~~~~~
C:\Users\nikla\Documents\Arduino\libraries\Elegoo_TFTLCD\Elegoo_TFTLCD.cpp:352:5: note: in expansion of macro 'writeRegister16'
     writeRegister16(ILI9341_VCOMCONTROL1, 0x2B2B);
     ^~~~~~~~~~~~~~~

It would be an excellent idea to print something during startup, e.g.

  if(proDebug)
  {
    Serial.begin(9600);
    while(!Serial) {};
    Serial.println(F("Plot program V 0.1"));
  }

as well as to make sure that the serial monitor program and your code are set to the same serial Baud rate.

PS: I glanced through the plot code, and when I see crap like this, I wonder why it ever worked, and would be strongly tempted to delete the entire package and look elsewhere for inspiration:

  uint16_t identifier = tft.readID();
  identifier=0x9341;

  tft.begin(identifier);

There are plenty of other problems with the code, so be warned!

This topic was automatically closed 180 days after the last reply. New replies are no longer allowed.