Does it kind of look like a squarewave but with ripples along the flat sections or kind of like spikes at 10 MHz
If it's on a solderless breadboard with long wires on the ground and 5V connections, that's kind of what I would expect.
To be honest, that doesn't actually look all that bad for 10MHz in a solderless breadboard.
Do you use a 1:10 probe and did you calibrate it?
3 Likes
Good point!
I use a 1:10 probe and calibrated it.
But Thank you to you all I will try solder it and then hook it up to the scope and will see what it shows.
What frequency is the oscillator supposed to produce?
What frequency is the scope measuring?
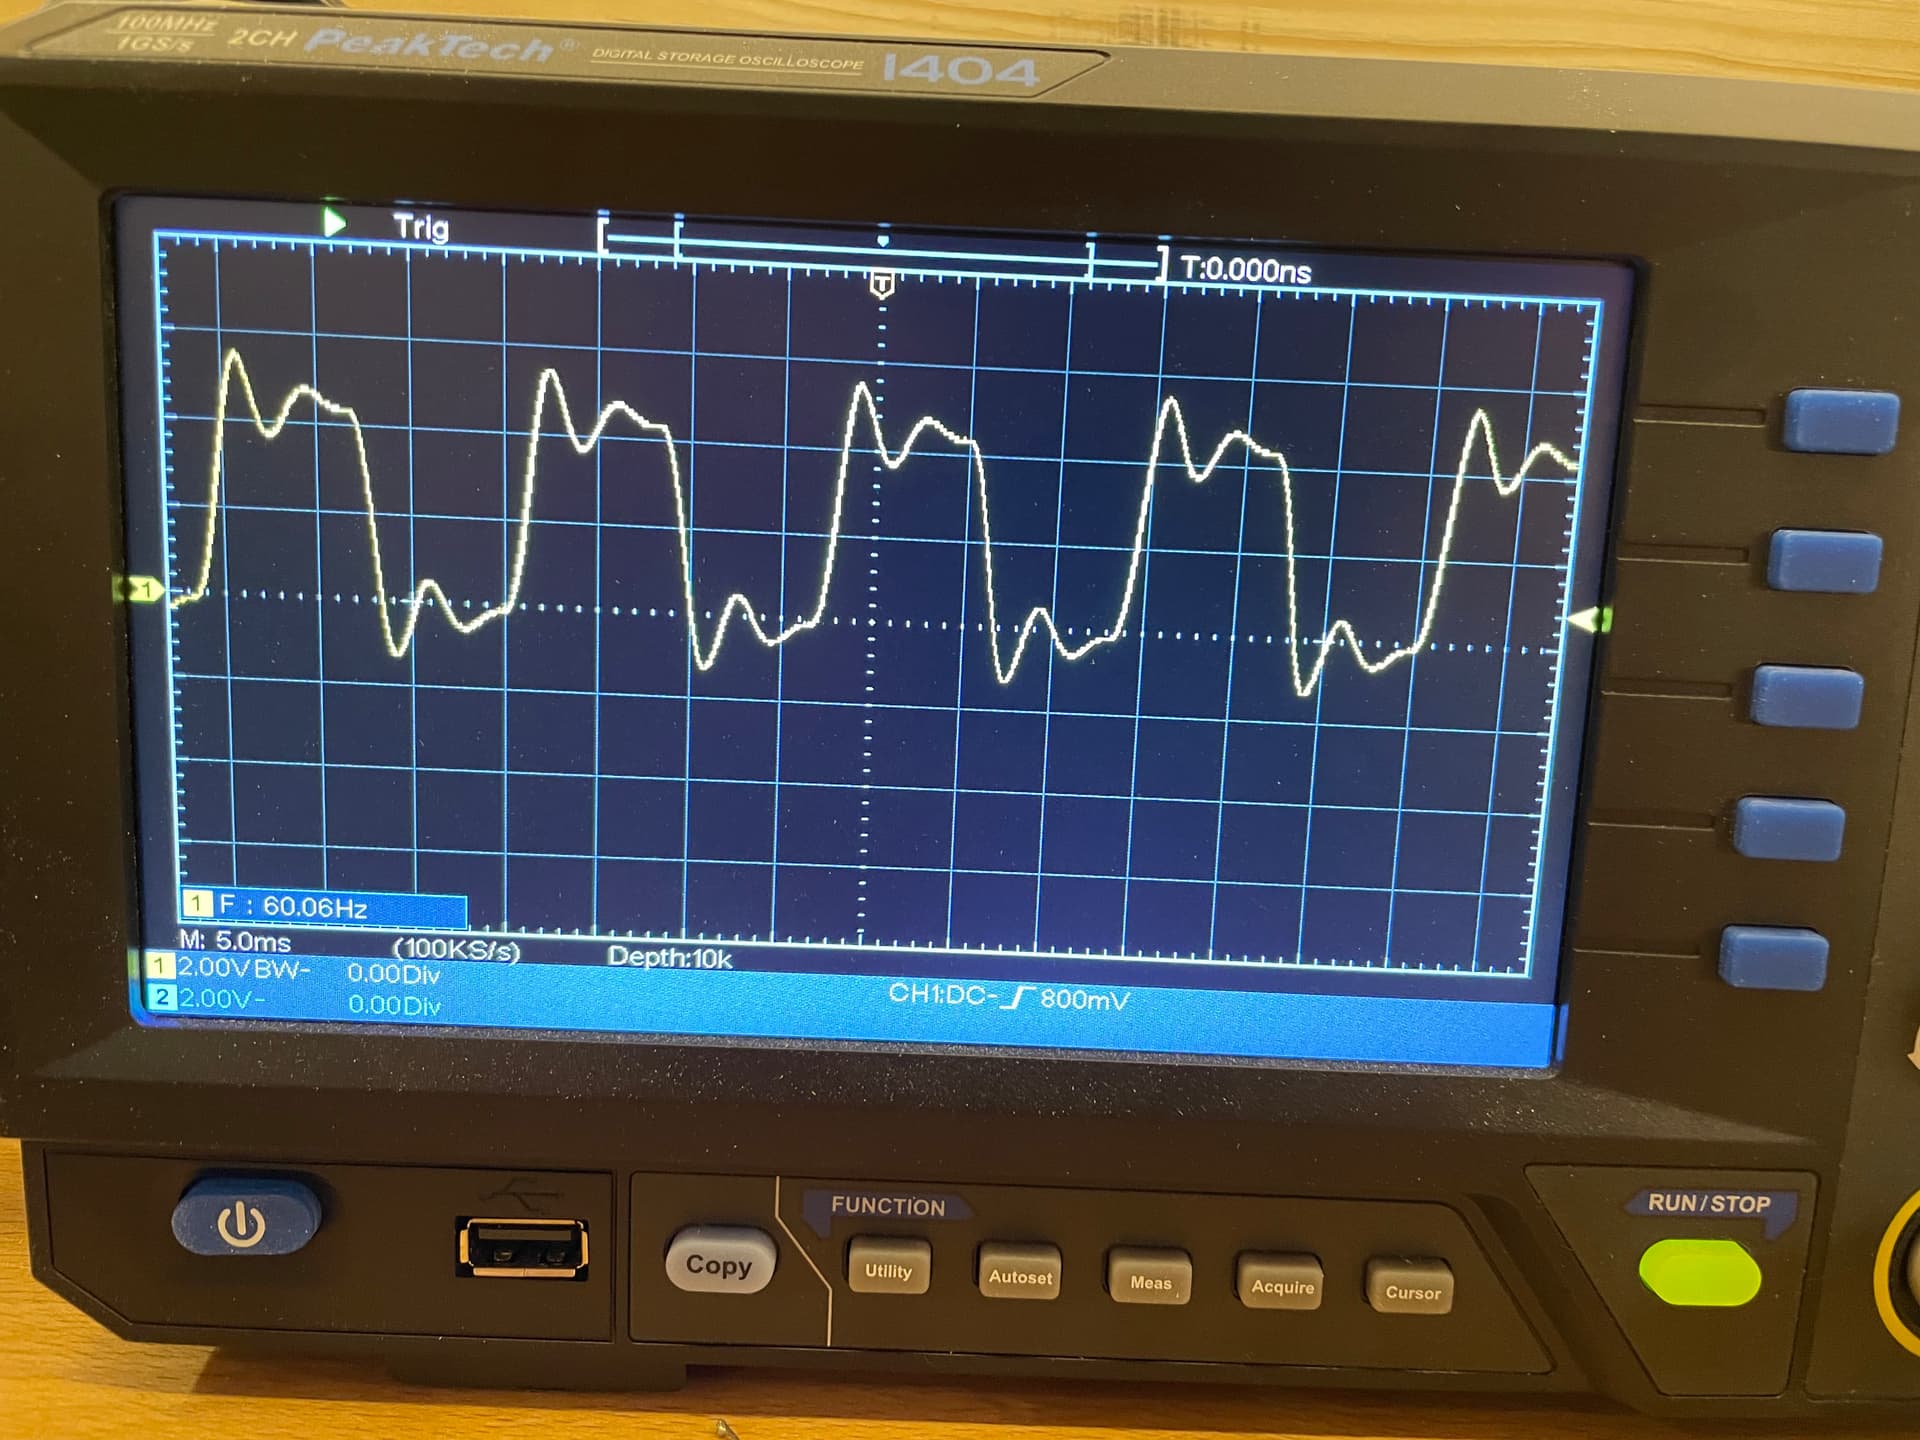
The data on the scope screen make no sense to me. At 100K samples/second you won't be able to measure a 10 MHz signal. The F: 60.06 Hz doesn't look very promising, either.
3 Likes
Are you absolutely sure the crystal is around the right way?
I have tried it to hook it up with only crocodile clamps and the scope probe and the wave is now square but the frequency is not right but I think it is because of the electrical noise in the room. Thank you
Those devices are really designed to be soldered onto a PCB with proper decoupling caps and short low impedance traces. They actually draw a lot of current so a 0.1uF very close to the pins and a 1uF close by is a good idea. I have used them on a PCB plugged into an 8 pin dip socket with good results but for frequencies less than 16MHz only.
2 Likes
The waveform that you are seeing on the oscilloscope trace in post #22 is an artifact of what is known as aliasing.
This is something that happens if you sample the waveform at too low a frequency.
See this extract from the PeakTech 1404 manual:

You need to change your timebase to a much higher speed such as 50ns per division.
I haven't been able replicate your waveforms completely as I can't set my oscilloscope to exactly the same combination of timebase, sampling rate, and memory depth as yours, but see the following example traces:

Here is a 10 MHz signal correctly displayed with the timebase on 50ns per division.
If I slow down the timebase to 5ms per division I get the following trace:

Here I can see that the trace is not being displayed correctly, but this is because I am taking 14 million samples.
Your oscilloscope can only take 10k samples in total - This is the maximum record length of your oscilloscope (see p61 of the manual).
Now look what happens if I turn down the memory depth to 14k samples (closest I can get to your 10k samples):

I now see a waveform, but can no longer tell that it is not the desired correctly displayed waveform.
I have to set the timebase a bit slower to display something similar to your trace:

Note that the frequency counter displayed in the top left hand corner of the trace always shows 10MHz even though the trace 'appears' to show a frequency around 5.5Hz.
If you change your timebase speed up to 50ns per division then you should be able to see the 10MHz waveform correctly.
You will need to turn the timebase control 15 clicks clockwise from your current position to get to the right setting.
2 Likes
I think it's OK.
Digital doesn't have to be "perfect".
And the 'scope probe capacitance can sometimes cause ripples that might not be there when the probe isn't connected. But I'd bet it works in the circuit with the probe connected or not.
Thank you very much I did not know this about scopes
It pays you to work out what the period of the expected waveform is, and then you can set the timebase to an appropriate value.
So for 10MHz, period = 1s / 10^6 = 100ns
Then you can set the timebase to somewhere around 100ns per division.
Have you managed to get a satisfactory result now?

This is now my result and I am very satisfied with it. But now my circuit does not work as expected so I will check this next. Thank you all for your help and have a nice day.
This topic was automatically closed 180 days after the last reply. New replies are no longer allowed.