This is to recap older posts about debugging Arduino Nano 33 BLE with nRF52840 microcontroller via SWD that were at the time discussed for beta version of Arduino IDE v2 in threads Debugging nano 33 BLE with IDE 2-b4. Debug configuration? and Information about debugging?
I decided to do a rewrite, especially as there are some minor, but nevertheless relevant changes how Arduino Nano 33 BLE can be in-circuit-debugged with the release version of Arduino IDE v2. Officially, in-circuit-debugging of Arduino Nano 33 BLE is not yet supported according to: https://docs.arduino.cc/software/ide-v2/tutorials/ide-v2-debugger , but as you can see below, it does work with some manual work.
For in-circuit-debugging, a hardware debugger is required. For the tests, I used Segger J-Link EDU mini, attached to Serial-Wire-Debug (SWD) port of the Arduino Nano 33 BLE (try to use as short cables as possible):

The following example uses Windows, adjust accordingly, if you use another OS (especially, if using Linux or Mac, please see the post by ptillisch from Arduino Team below for further tips). To proceed:
- Install Arduino IDE v2 (tested with v2.0.3): https://www.arduino.cc/en/software
- Install latest Segger J-Link Software and Documentation Pack: SEGGER - The Embedded Experts - Downloads - J-Link / J-Trace
- Start Arduino IDE and open Board Manager (Tools -> Board -> Board Manager) and install "Arduino Mbed OS Nano boards" (at the time of writing v3.5.4)
- Create a sketch, for example, I will use the File -> Examples -> 01.Basics -> Blink that I copy to a new location.
- Close Arduino IDE for now.
- In the same folder, where the sketch *.ino file is residing, create, e.g. with a text editor, debug_custom.json with following content:
{
  "servertype": "jlink",
  "device": "nRF52840_xxAA",
  "interface": "SWD",
  "serverpath": "C:/Program Files/SEGGER/JLink/JLinkGDBServerCL"
}
In case you installed the Segger J-Link software to another location, adjust the serverpath accordingly.
7. In the folder, where the sketch *.ino file is residing, create a subfolder .theia (do note the dot in the beginning!) and in .theia subfolder create a file launch.json with following content:
{
  "version": "0.2.0",
  "configurations": [
    {
      "cwd": "${workspaceFolder}",
      "executable": "./bin/executable.elf",
      "name": "Debug with JLink",
      "request": "launch",
      "type": "cortex-debug",
      "device": "",
      "runToEntryPoint": "main",
      "showDevDebugOutput": "none",
      "servertype": "jlink"
    },
  ]
}
- Under your user profile (in Windows C:\Users\<username>) navigate to AppData\Local\Arduino15\packages\arduino\hardware\mbed_nano\3.5.4 and create there a platform.local.txt file with the following content:
debug.executable={build.path}/{build.project_name}.elf
debug.toolchain=gcc
debug.toolchain.path={runtime.tools.arm-none-eabi-gcc-7-2017q4.path}/bin/
debug.toolchain.prefix=arm-none-eabi-
debug.server=openocd
debug.server.openocd.path={runtime.tools.openocd-0.10.0-arduino7.path}/bin/openocd
debug.server.openocd.scripts_dir={runtime.tools.openocd-0.10.0-arduino7.path}/share/openocd/scripts/
debug.server.openocd.script={runtime.platform.path}/variants/{build.variant}/{build.openocdscript}
Please do note that the AppData folder is hidden by default in Windows.
9. Attach the J-Link debugger as well as Arduino Nano 33 BLE to your computer via 2 USB cables.
10. Open the sketch in Arduino IDE v2, select under Tools -> Board -> Arduino Mbed OS Nano Boards -> Arduino Nano 33 BLE
11. Put a breakpoint at the beginning of the setup() function block (by clicking in front of the line number) and click Start Debugging icon (the third icon from the left on top of the IDE).
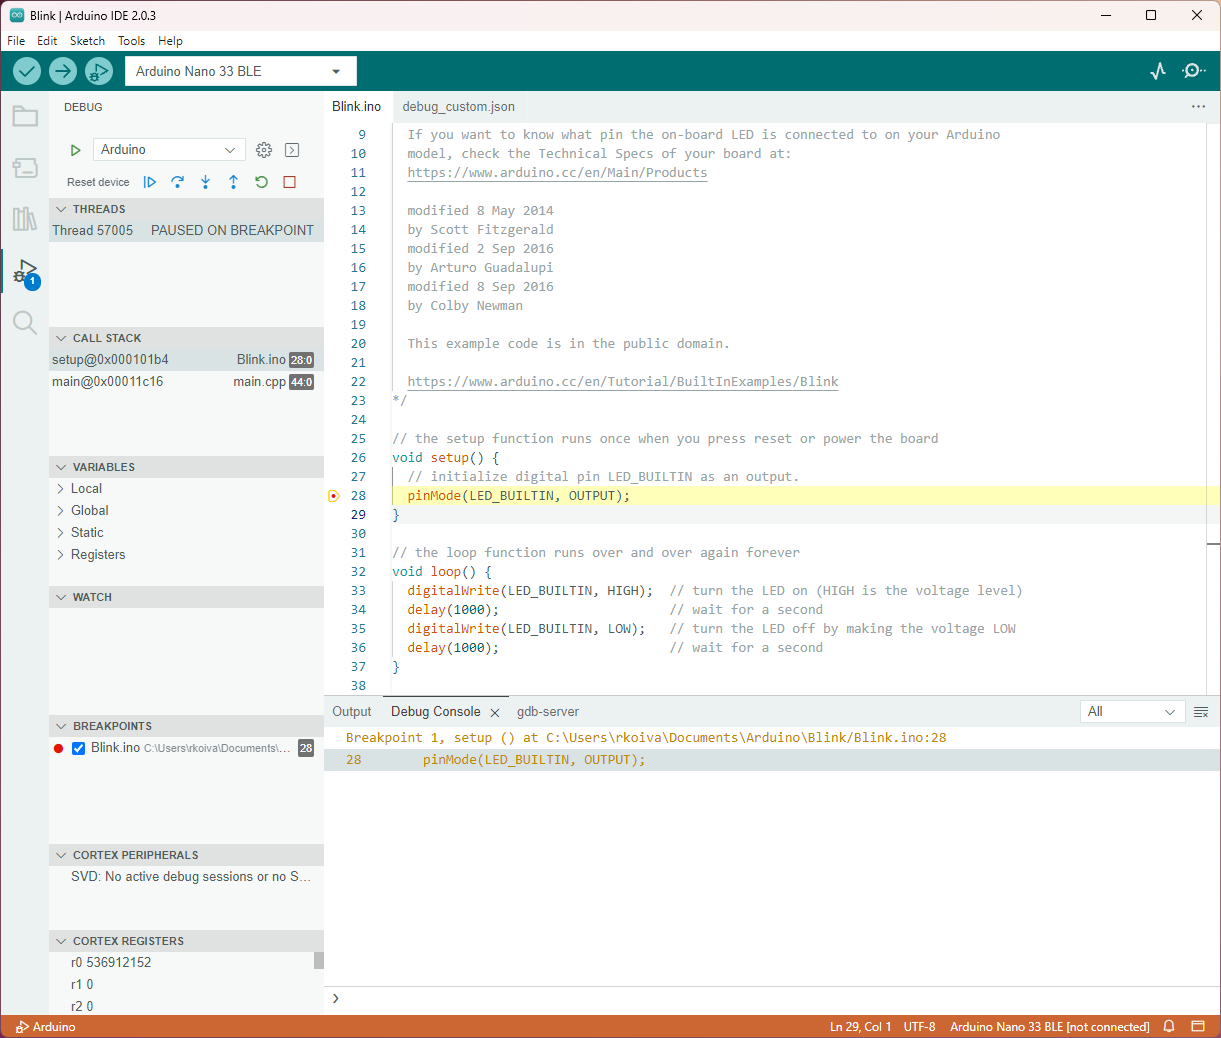
You should now be able to step through code, set breakpoints and inspect variables.
In case anyone has any tips or improvement suggestions to the above, I would be very interested to hear them.