I was doing some tidying up on my program and after commenting out several lines I noted a big drop in memory usage. I uncommented one of the lines and usage jumped by twenty-four bytes.
Seems like a lot for one line - lots of indirect addressing I imagine. Anyhow, I was wondering if there's a way to see how a given line/statement reads after the compiler is done with it.
I don't have any purpose in mind, I just wanna see what it looks like.
Not sure how to turn on assembler generation, but with verbose output during compilation you can see where
the build directory is and find the build files.
If you turn on debugging output during compilation in the IDE preferences, you'll find in the forth-last line the ELF file (with extension *.elf) the compiler generated. Using the command
I uncommented one of the lines and usage jumped by twenty-four bytes. Seems like a lot for one line
The compiler needs to know the offset from the start of the ramWindowValHiLim to write to. It needs to know the offset from the start of the textAndParms array (of strructs?) to read from. It needs to calculate the offset within the block of memory where the struct resides, to the parmVal member. It needs to copy the textAndParms[screenNow].parmVal value to a register. It needs to add 2 to the register, and it needs to copy the result back to the ramWindowValHiLim[0].
pylon:
If you turn on debugging output during compilation in the IDE preferences, you'll find in the forth-last line the ELF file (with extension *.elf) the compiler generated. Using the command
I put this in "c:\program files (x86)/arduino/hardware/tools/avr/bin/avr-objdump –d C:\Users\Owner\AppData\Local\Temp\arduino_build_791444/turret_9_07_0053.ino.elf" and saw what looked like a hex dump. Hard to tell since it was there and gone in a few tenths of a second. Appearance is like a DOS window, white characters on black .
PaulS:
The compiler needs to know the offset from the start of the ramWindowValHiLim to write to. It needs to know the offset from the start of the textAndParms array (of strructs?) to read from. It needs to calculate the offset within the block of memory where the struct resides, to the parmVal member. It needs to copy the textAndParms[screenNow].parmVal value to a register. It needs to add 2 to the register, and it needs to copy the result back to the ramWindowValHiLim[0].
24 bytes seems small to me, to do all that.
Well, when you put it like that... And yes, array of structs.
Yikes! I'm not ready for that yet. This is obviously not an "all 'ya gotta do is..." endeavor. Plus, it seems to be a fairly serious diversion right now from my project.
Load screenNow into a register
Multiply by sizeof textAndParams
Add the offset of parmVal in the struct
load the location of textAndParams into some registers
do a fetch-with-offset
add two to that value
load up the location of ramWindowValHiLim into some registers
store the computed value to that location
PaulMurrayCbr:
Load screenNow into a register
Multiply by sizeof textAndParams
Add the offset of parmVal in the struct
load the location of textAndParams into some registers
do a fetch-with-offset
add two to that value
load up the location of ramWindowValHiLim into some registers
store the computed value to that location
24 bytes seems pretty reasonable to me.
I learn something here most every day. I did not realize all that was going on under the hood!
dougp:
I learn something here most every day. I did not realize all that was going on under the hood!
I had a mate who was attempting to write some code to talk to an N64 controller. Microsecond pulses. He had pared and pared down his code using assembler, but it still wasn't fast enough. I had a look at it, and it had this innocent-looking while loop around the assembler block
while(x < foo.bar) {
  do heavily-optimised assembler
}
The problem being that 'foo' was a reference passed in as a parameter. Looks simple, until you think about what the compiler has to do to get that value foo.bar . I told him to move foo.bar into a constant allocated on the stack:
And instantly his loop had more than enough time to do the stuff it had to do.

You get a feel, I supose, for just how ambitious the very idea of a compiler and a programming language might have been. We take it for granted, now, but it's a work of genius.
I put this in "c:\program files (x86)/arduino/hardware/tools/avr/bin/avr-objdump -d C:\Users\Owner\AppData\Local\Temp\arduino_build_791444/turret_9_07_0053.ino.elf" and saw what looked like a hex dump. Hard to tell since it was there and gone in a few tenths of a second. Appearance is like a DOS window, white characters on black .
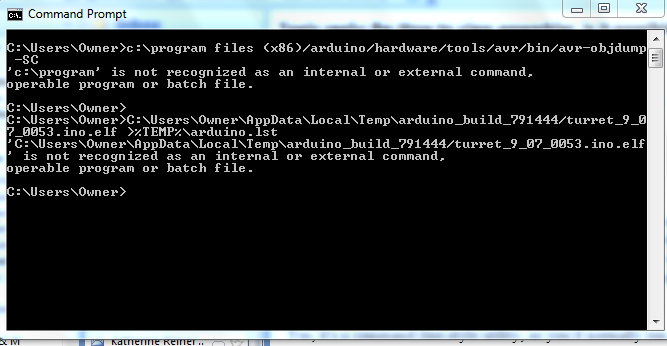
Yes; it's a command-line-style utility, so you'd normally run it in "Command Prompt" window, and pipe it through more or redirect to some output file. Also, you probably want to use "-SC" instead of "-d", as that should give you a mixed source/assembly listing with C++ symbols de-mangled, making it easier to follow.
westfw:
Yes; it's a command-line-style utility, so you'd normally run it in "Command Prompt" window, and pipe it through more or redirect to some output file.[/quote]
Here are my results from entry in a command prompt window. Perhaps I've lost too many brain cells.
PaulMurrayCbr:
I had a mate who was attempting to write some code to talk to an N64 controller. Microsecond pulses. He had pared and pared down his code using assembler, but it still wasn't fast enough. I had a look at it, and it had this innocent-looking while loop around the assembler block
while(x < foo.bar) {
do heavily-optimised assembler
}
The problem being that 'foo' was a reference passed in as a parameter. Looks simple, until you think about what the compiler has to do to get that value foo.bar . I told him to move foo.bar into a constant allocated on the stack:
And instantly his loop had more than enough time to do the stuff it had to do.
You get a feel, I supose, for just how ambitious the very idea of a compiler and a programming language might have been. We take it for granted, now, but it's a work of genius.
I would have thought that the compiler should have already done that, even without optimization turned on.