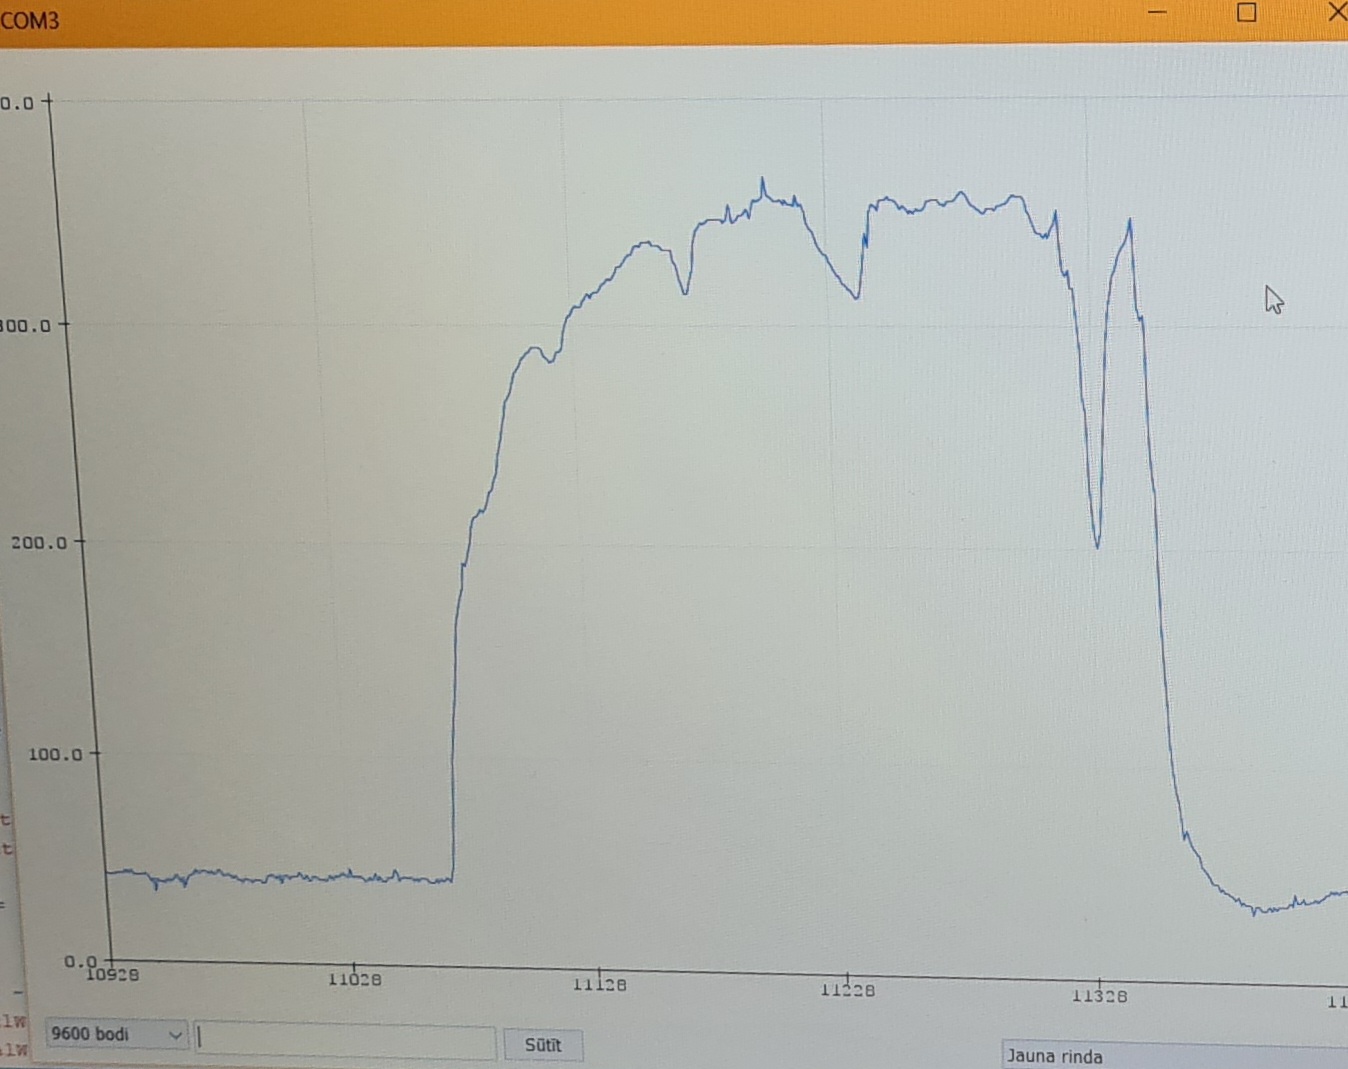
Hi, a question about the graph, the value displayed on the y axis. The project involves the use of a photodiode, and the graph shows the values of the photodiode. What is it? Resistance in ohms or what?
Without seeing the code and schematic, impossible to know
It is what ever you printed to the serial plotter. Only you know this without showing your code.
y=f(t)=What is it? ![]()
Graph is plotted from analog input pin
But analogRead returns an int, not a float.
If we guess that the photoresistor is in series with another fixed-resistor, with a voltage applied, you have a voltage divider.
Since the resistance changes with light, voltage across the photoresistor changes with light and you can measure the voltage with the Arduino's analog input, and then plot it.
Depending on how it's wired, more might may put-out more voltage, or more light may put-out less voltage.
Note that the voltage out of the voltage divider is proportional to the resistance ratio. So it's not linear. (We don't perceive light-level linearly either, but that's different.)
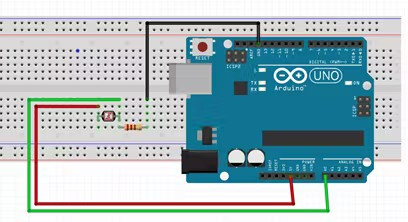
I have this kind of circuit. So how can i make that in graph values will be showing in volts not random values like i have right now
The graph you showed doesn't look very random to me.
We still can't see your code.
1 Like
It looks like potrzebies versus milligram/amperes to me.
a7
Have you tried covering the photo sensor with black tape and then exposing to light?
Although the analog-to-digital converter is reading voltage it doesn't automatically read units of "volts". It reads 0-5V as 0-1023 (assuming the regular Arduino with the 10-bit ADC and a 5V reference). So 1V should read about 205 on the ADC.
Then I think the serial plotter scales that again to a range of 0-500, but I don't know much about the serial plotter.
1 Like
Serial.println(analogRead(A0));
I have already said that graph is based on photoresitor data
So, the scale is raw analogue readings.
I don't know why it took so long to find that out.
Yeah, thanks! You are right because in program i write that if value of the graph is 40 than do that and etc. And i tested with voltmeter how many volts is when value 40 is reached, and voltmeter showed 0.2V. So if 1023 = 5v than, 40 = ~0.2
It's all relative, so 1023 is Vref minus one LSB (whatever Vref happens to be)
This topic was automatically closed 180 days after the last reply. New replies are no longer allowed.