Hello there,
I'm an Arduino lover from Taiwan.
Recently, I'm developing several projects with Arduino running on different platforms like STM32 or ESP32. And I found it is essential for debugging a complex project that knowing how the underlying firmware actually works. For example, I need to know how does the HardwareSerial and the lower-level UART behave to identify the problem of receiving buffer overflow. Another example is that I need to figure out the detailed implementation of millis() and delay() on the specified platform to obtain precise timing in my application.
The straightest way to understand what's going on in the Arduino core is by reading the source code, a.k.a. code tracing. Nevertheless, there are over 40 thousand lines of the source code in the ArduinoCore-avr and even up to 700 thousand lines in arduino-esp32. So directly reading the source code is an infeasible and time-consuming job. Luckily, we have some awesome tools, like cscope and ctags for instance, to provide us the cross-references and the location of symbols across plenty of source codes. However, the organization of Arduino sketches has a huge difference from ordinary C++ projects. Result in we cannot directly apply normal code tracing tools on Arduino sketches.
Thus, I came out with this tool called arduino-cscope-ctags. The purpose of this tool is to simplify the work to generate the database of cross-references from the Arduino sketch, cores variants, and libraries. Once the database is generated, you can begin to trace the code use cscope/ctags with any text editor like vim, emacs, vscode, or sublime text. This tool extremely reduces the hardness of tracing the source code with Arduino and makes we can further construct solid knowledge on how the underlying firmware actually works to reduce the time spent on debugging. The following section presented two possible scenarios that can greatly be assisted by arduino-cscope-ctags.
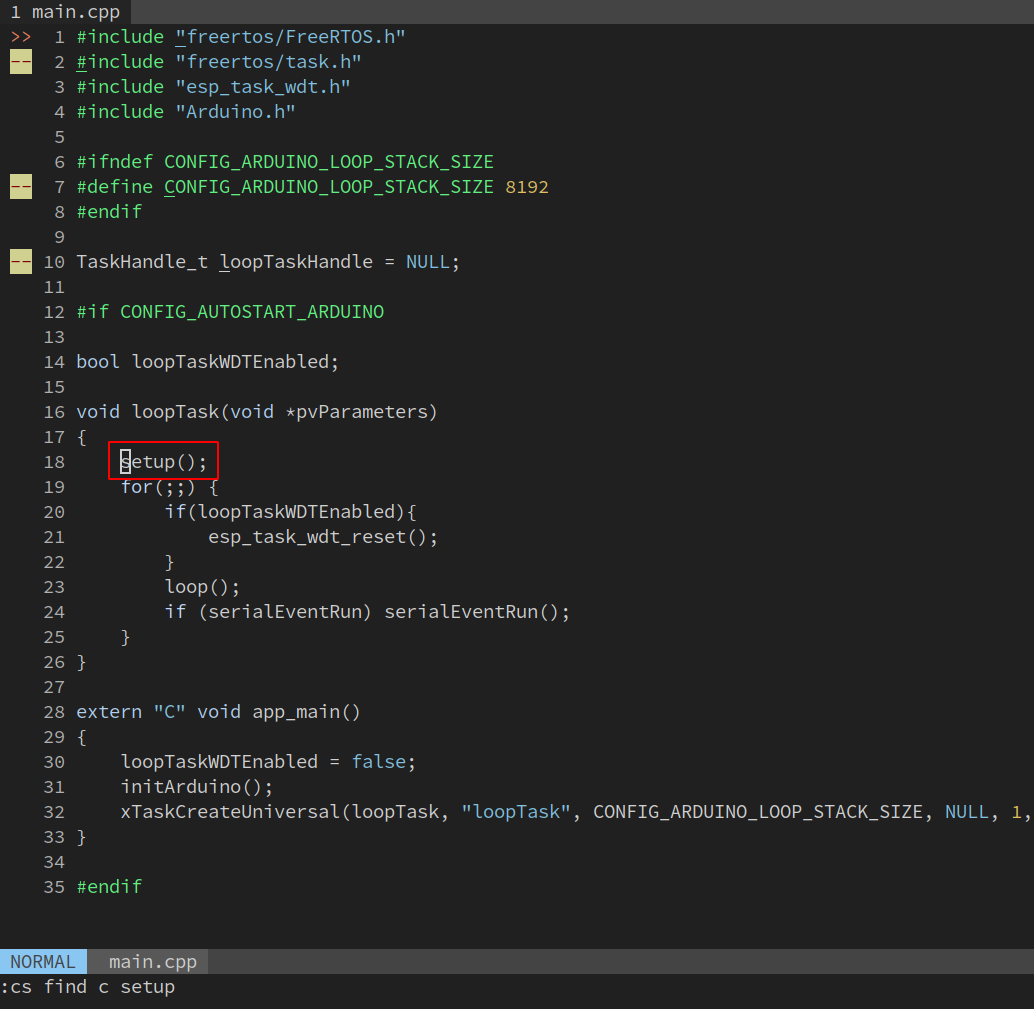
Use case #1: Finding How setup() and loop() is Called in ESP32
The story about how setup() and loop() is called in ESP32
-
After the database of cross-reference is loaded, we can use
:cs find c setupin vim to search where is thesetup()function be called.
-
We can clearly see that
setup()andloop()are called in a FreeRTOS task in ESP32. Which is greatly different from what ArduinoCore-avr does.

Use case #2: Figure Out the Implementation of HardwareSerial in ESP32
The process to investigate the Implementation of HardwareSerial in ESP32
-
Once you built the cross-references, navigate to the symbol you want to find and hit
Ctrl+]. And you will jump to the definition of that symbol,Serial.read()in this example.
-
The implementation of
HardwareSerial::readis in the source file "HardwareSerial.cpp". And it's just calling the function of underlying UART,
-
The underlying implementation of UART in ESP32 uses a queue of FreeRTOS to buffer incoming data.
-
The data is transferred from the hardware FIFO buffer to the queue in this function, which is called every time you calling
Serial.read().


Conclution
To summary, you can use the new tool arduino-cscope-ctags to investigate what is the true mechanism below the Arduino sketches and may help you to build solid knowledge with the platform you used. And eventually, this knowledge may further improve the efficiency of debugging when making complex projects.
For more information, please leave a comment below or visit GitHub for further assistance.
https://github.com/ifTNT/arduino-cscope-ctags
Hope you guys love it! ![]()
