/*This code make interesting pattern*/
#include <UTFT.h>
extern uint8_t SmallFont[];
UTFT myGLCD(CTE32HR,38,39,40,41);
float f;
int x;
int y;
int sx;
int sy;

void setup(){
  myGLCD.InitLCD();
  myGLCD.setFont(SmallFont);

  myGLCD.setColor(VGA_BLACK); //background color
  myGLCD.fillRect(19, 13, 479, 319);

  myGLCD.setColor(VGA_WHITE); //Cross color
  myGLCD.drawLine(19, 166, 479, 166);
  myGLCD.drawLine(249, 13, 249, 319);

  myGLCD.setColor(VGA_BLUE);

  //f=a
  float a=(0.1) ;

  /*
  myGLCD.drawPixel(0+249, 0+166);//debug code
  */
  //Begin main
  for (y=-153; y<154; y++){
    for (x=-230; x<231; x++){


      f = sin(x*y) ; //main


      sx = x+249;
      sy = 166-y;
      if ( ((f<=a) && (f>=-a)) ){
        myGLCD.drawPixel(sx, sy);
      }
    }
  }
  //End main
  myGLCD.setColor(255,255,255);
  myGLCD.print("Done",0,0);
}

void loop(){

}
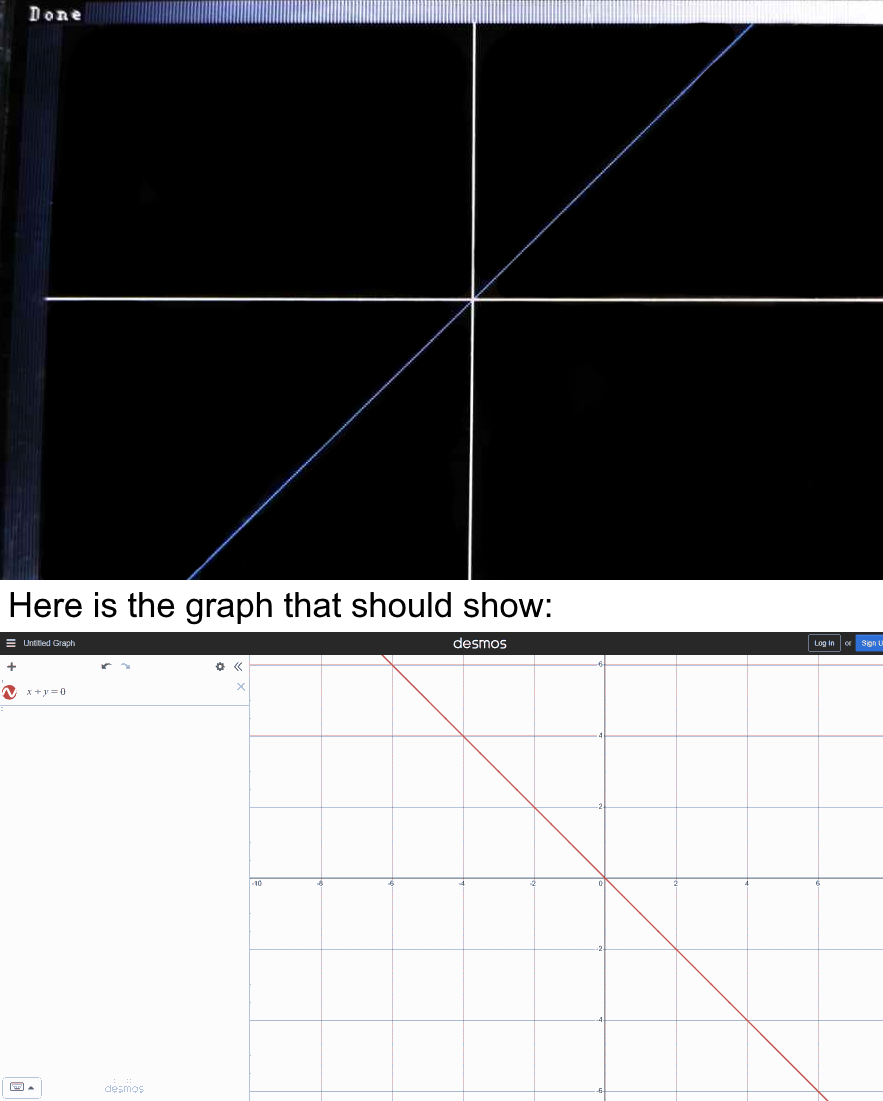
I don't know why it just shows the wrong way, I have tried very much but still not working.
By the way, if you can please help me shorten the code. Thank you.
I think you are probably correct, but did you test that to be sure? Maybe the library you are using moves (0,0) to the bottom left, for example.
If we assume you are correct and (0,0) is the top left corner on the screen, then the screen is not like the graph application from your pc. In that graph application, low Y values are at the bottom of the screen and high Y values are at the top. But on your TFT screen, low values are at the top and high values are at the bottom.
To change the plot origin from the top left to the bottom left corner, and have y increase vertically, instead of: drawPixel(x,y)
use drawPixel(x,(YMAX-1)-y)
where YMAX is the screen height in pixels.
Another way to "turn the screen upside down" would be to change this:
to this:
sy = 166 - y;
Nobody is born with the skill and knowledge to code, it takes practice. Some people have naturally more aptitude than others, which helps, but even more important is whether you enjoy it and are interested in it. That's true for almost anything in life, I think!
Thank you for helping me. I love coding and discovering new ways to make code more efficient. by the way thank you for helping me.
1. Main
The code is now working perfectly. I have updated the post.
1. 1. Code Changed
From this:
sy = y + 166;
to this:
sy = 166 - y;
just that
1. 2. Its Limit
The graph code just works correctly with " 'expression' = a "
"a" is a number that can be changed to make the graph show more detail,
too much will fill the screen but too little will show nothing.
That means you should change the number depending on the 'expression' to make it work.
1. 3. Something more
I started to shorten the code to the assembly form(if I can because I am learning).
My goal is to make the code effective as possible(in storage space and fast).
1. 4. Why I make this?
actually, I love typing expressions into desmos to see the lines and beautiful images pop up. the other day I watched this guy make a youtube video about Graphic Calculators with Minecraft Redstone and explain how it works. and that's the idea of drawing graphics on Arduino.
2. Thank you
I can't link, sorry
Thanks to:
2. 1. UKHeliBob
Move my topic to a suitable category. Make my code possible.
Thank you!
2. 2. aarg
Suggest me to use the line drawing command instead of pixel drawing. It is good to use a line but it needs 2 points to draw and I still haven't figured out the code. btw
Thank you!
2. 3. PaulRB
Solution of my code to make it work. Just a single line of code makes it not work, now it works.
Thank you!