Hi everyone
Initially i CALBRIATE the value in first step.. so didn"t get proper sine value while i turning 100k pot also
Connection Arduino to zmpt101b
5V TO VCC
A1 TO OUT (I Checked here in multimeter 2.53v in zmpt101b)
GRD TO GRD product link zmpt101b
void setup() {
  Serial.begin(9600);

  // Set analoge pin to input
  pinMode(A1, INPUT);
}

void loop() {
  // Read analog input
  Serial.println(analogRead(A1));
  delay(20);
}
What do you think that does. delay(20); // wait a full 50Hz sine wave, and measure at the exact same point of the wave
Successive voltage sample will be almost the same as the first one, being at the top of the wave or at zero crossing.
Leo..
Ashwin21,
In order to show you the issues mentioned in Johnerrington's post #7, I've modified your code slightly to turn a pin high just before your analogRead, and low again after the analogRead, so that the analogReads can be seen on an oscilloscope.
I used direct port manipulation for negligible effect on the timing of the code.
int monitorPin = 12;

void setup() {
  Serial.begin(9600);

  // Set analoge pin to input
  pinMode(A1, INPUT);
  // Set monitor pin to output
  pinMode(monitorPin, OUTPUT);
}

void loop() {
  // take monitor pin high
  PORTB = B00010000;
  // Read analog input
  Serial.println(analogRead(A1));
  // take monitor pin low
  PORTB = B00000000;
  delay(20);
}
Here are the results on an oscilloscope .
The yellow trace is a 50Hz, 4V peak to peak sinewave.
The red trace is the serial printing (decoded below the trace).
The blue trace is the pin that is high during the analogRead.
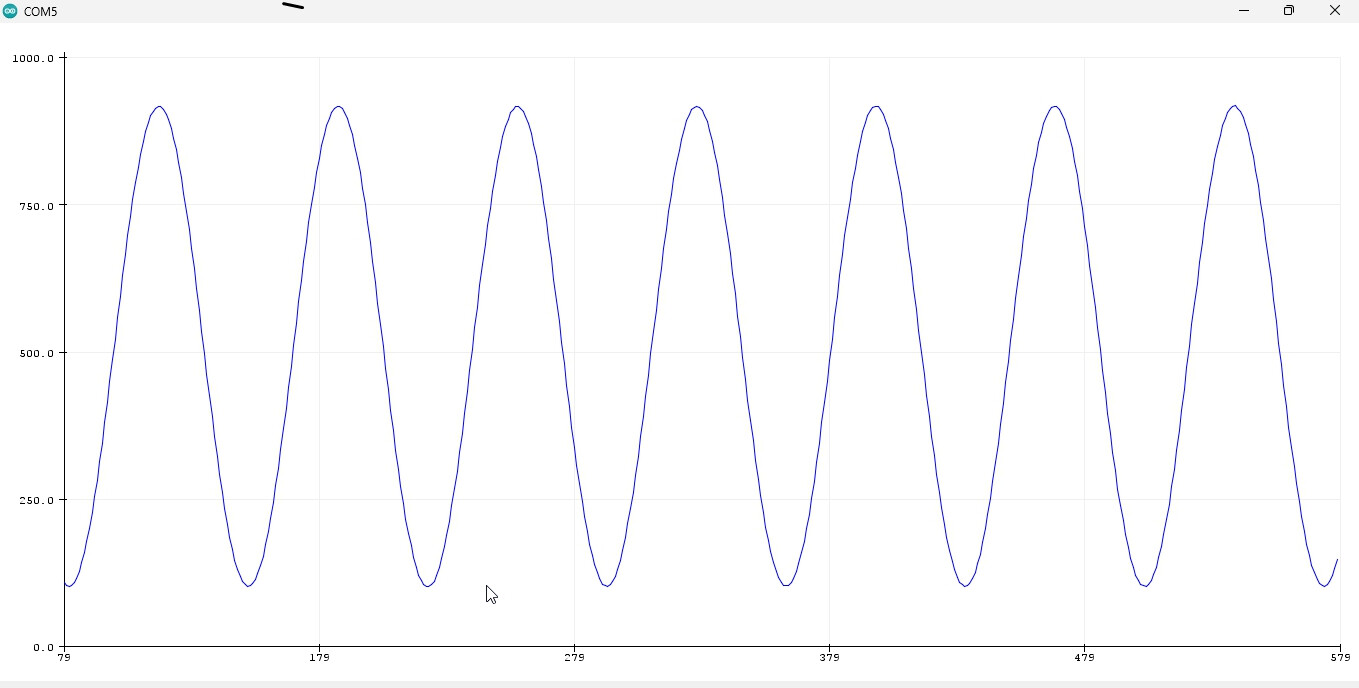
You can see that you only take one reading/sample for each cycle of the 50Hz signal. The sampling point is slightly later each cycle. This can be seen on the decoded serial printing: 575, 610, 645.
This plot appears to show 7 cycles in a time of approximately (500 x 20ms) = 10s.
This corresponds to an 'apparent' frequency of just over 1.4Hz - not the actual 50Hz input frequency. This is the aliasing that John Errington mentions.
I remember using a teletype at University to talk to the department of Electrical and Electronic Engineering's digital computer.
As an undergraduate we never actually saw the computer itself. (I was shown it briefly, during my interview for going there.)