The Dashboard Chart shows different values than in the Gaudge, the real values of the variable are those of the Gaudge. If I change the Chart to LIVE mode, then the actual values are measured in that display, but going back to 1H (One hour), they are still displayed incorrectly. More details: Locally, the sound sensor detects 50dBA, updates the dba variable in ArduinoCloud, the dashboard shows 50, but the Chart, shows 45, the reading of the Chart in LIVE mode, does collect the variable in real time, but the other visualizations never collect that data.
Hi @xeviott ,
thank you for reaching out us in the forum.
Could you please send some screenshot of the issue you are encountering?
Moreover a more detailed explanation of it.
Thanks
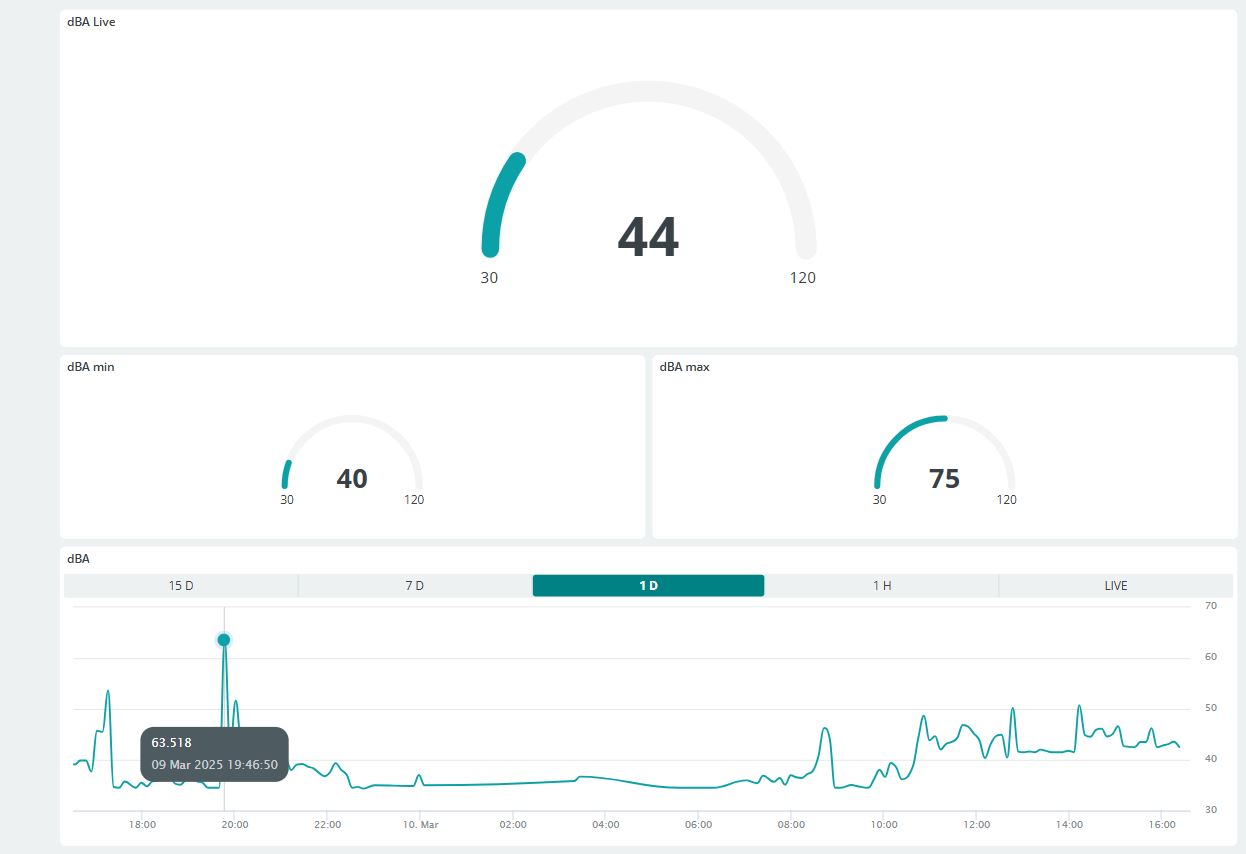
Hi, I'll try to be clear and add a screenshot. I have an ESP32 sending 3 variables to ArduinoCloud. The first variable collects the live sound of the dB (decibels), the other sends the minimum decibels that have been recorded, and the other the maximum. The 3 Gaudge dashboards show the same data that I collect my Serial Monitor from the IDE locally, but the Chart dashboard always shows less. For example, if the limit reached 75db, the Chart shows a maximum (see photo) of 63db, at first I thought it was a delay, but I've been taking high volume captures (my neighbors are witnesses), and they are never accurately reflected, as the Gauge does. If I select the Chart in LIVE, I see the correct data live, but not in the other modes (1h, 1Day....)
Add that the variables I use are int, without decimals, but the photo in the Chart shows a few decimals?
Hi @xeviott,
thank you for your detailed explanation.
The behaviour you are encountering it's correct.
The Chart and Advance Chart Widget aggregate the data for temporal selection. The only difference between the two widgets is that the Simple Chart aggregates the data as an average of all data. For Advance Chart Widget is possible to use different type of aggregation. You can see a more detailed explanation here New data aggregation feature in the Advanced Chart widget.
Feel free to ask any question.
Thanks
Well, his explanations were very helpful and clear.
Thank you
This topic was automatically closed 180 days after the last reply. New replies are no longer allowed.