Frequency measurement mystery

Hello, I am hoping someone has insight into what might be causing a phenomenon I cannot explain!

Here is the basic setup:

  • I am using an Arduino Nano clone (from Elegoo) to turn on an infrared LED by setting digital pin 2 (in output mode) to HIGH.
  • I then use an OSRAM TSL237 light-to-frequency converter to measure the intensity of the LED output. (The ultimate intent is to pass the infrared beam through a sample to measure the clarity of the sample.)
  • To measure the frequency of the signal from the TSL237, I am using the ATmega328P's timers (either timer 0 or timer 1 on input pin 4 or 5, respectively) to count pulses from the TSL237.
  • I use internal timer 2 to measure 1 second and count pulses from the TSL237 using either timer 0 or timer 1 during that time, which provides a direct measurement of the frequency of the signal in Hz.

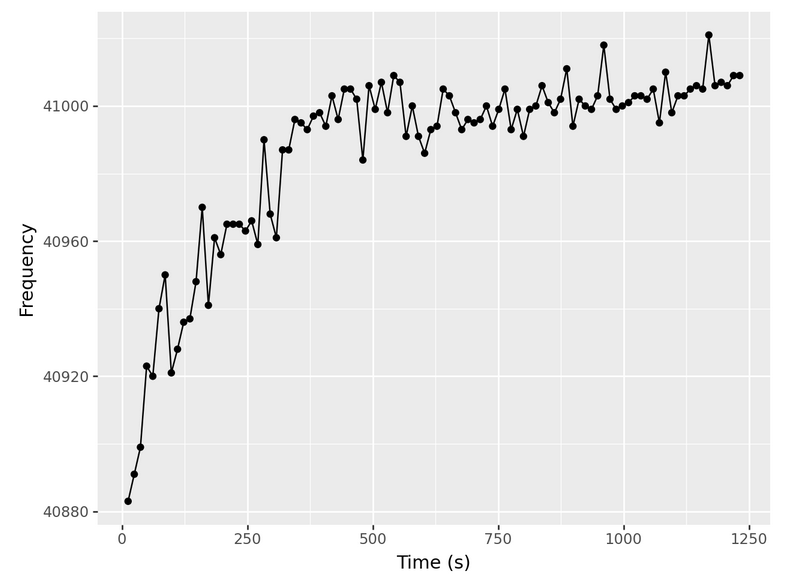
So that's the basic setup. (I'd be happy to provide more details if they would be useful!) It all works well except for one phenomenon I cannot explain. After turning on the device, the measured frequency increases over time for about 8-10 minutes and then stabilizes. Here is an example of typical frequency measurements, at approximately 12-second intervals, after startup:

I am currently unable explain this behavior. Here's what I've tried:

  • I suspected this was somehow linked to the temperature of the MCU, so I added code to pull the temperature reading from the ATmega328P's internal temperature sensor. Sure enough, the curve looks about the same, and if I do a simple linear regression of the frequency measurement and the MCU temperature, I get R^2 of 0.8-0.9. So that seems to strongly suggest this is somehow caused by the temperature of the MCU.
  • After discovering that, I wondered if the change in measured frequency could by caused by the Nano's ceramic resonator heating up, which would cause its frequency to decrease. If so, that would explain the artifact of getting higher frequency readings with hotter internal temperatures: the duration of a second, as measured by resonator ticks, would increase, leading to higher frequency readings. To test this, I hooked the Nano's timer input to an external signal source that should have been stable (a 250 kHz PWM signal generated by an Arduino Uno R3 that had been running for ~10 minutes to ensure temperature stabilization). To my surprise, the relationship between the Nano's internal MCU temperature and the measured frequency disappeared. The Nano measured a fairly steady signal frequency of ~250 kHz the entire time! So that seemed to disprove the resonator hypothesis.
  • Next, I wondered if maybe the voltage of the pin I'm using to turn on the LED (digital pin 2) was changing as the MCU heated up, causing the LED output to change. Very unlikely, I know, but I hooked up a multimeter to the output of pin 2 to check. It read a voltage of 4.76-4.77 V the entire time.

At this point, I am at a complete loss for what to try next! The TSL237 and infrared LED are both far away (relatively speaking) from the Nano, so I don't see any way temperature could be affecting them. Regardless, according the TSL237 datasheet, its frequency output is quite temperature-stable and actually decreases slightly with increasing temperature.

I've confirmed that I can effectively "solve" this problem by letting the device warm up for ~10 minutes before taking frequency measurements, but that is obviously not very satisfying!

I suspect I'm overlooking something obvious, and I'd greatly appreciate any suggestions for where to look next! Thank you!

Yes, the forum rules. Post the code, using code tags and a wiring diagram, with all pins, parts and connections clearly labeled, so that

  1. forum members can have some idea what you are talking about, and
  2. consider alternative explanations.

Posting instructions can be found in the "How to get the best out of this forum" post, linked at the head of every forum category.

Example: do you have a current limiting resistor in series with the IR LED? If not, you are damaging the output pin and possibly other parts of the processor.

Thank you for the reply! I will prepare a wiring diagram and post that when I can! In the meantime, to answer your question: yes, I have a 10 kohm resistor in series with the IR LED.

It looks correct you went to a stabilized frequency source (your time base) and things settled down, that is exactly what I would expect.

The frequency shift in your Arduino is temperature sensitive because all of the components drift with temperature change and age. The solution is to use a crystal in place of the resonator.

Way too large. Try 1K or 470R to give the light sensor some photons to count.

I suspected this was somehow linked to the temperature of the MCU

The frequency you are measuring is determined by the TSL237, which has a temperature coefficient, while the time base used to measure the frequency is the resonator or crystal on the MCU board, which has a different temperature coefficient.

Various effects determine the intensity of the light emitted by the IR LED: power supply voltage, LED current and LED temperature. So, you have a lot of possibilities to consider.

A better option might be to use a spectral sensor, which directly converts light intensity in separate wavelength bands to counts.

1 Like

The Atmega328P should not get warm.
Is this an Arduino board or self designed?

If you use a digital scope , make one pin Blink fast a few mSeconds and then measure the Period of the pulse to check if the clock drifts.

Thank you so much to everyone who replied! I will do my best to respond to you all!

The frequency shift in your Arduino is temperature sensitive because all of the components drift with temperature change and age. The solution is to use a crystal in place of the resonator.

I agree that a crystal would be better than the Nano's ceramic resonator. What I cannot explain, though, is why I see the "warm up" effect of an initial increase in frequency measurements when I use the IR LED and TSL237 as the signal source, but I do not see the initial increase when I measure an external signal source. If the resonator were the problem, I'd expect to see that initial increase in frequency readings either way, I'd think?

Way too large. Try 1K or 470R to give the light sensor some photons to count.

I've used resistors of varying sizes in the circuit, and I don't think 10 kohm is way too large. Given the proximity between the IR LED and the sensor, a resistor of this size results in an output signal from the sensor of ~41 kHz, which is very comfortably within the response range for the sensor, according to the datasheet.

The frequency you are measuring is determined by the TSL237, which has a temperature coefficient, while the time base used to measure the frequency is the resonator or crystal on the MCU board, which has a different temperature coefficient.

That makes sense! In this case, the IR LED and TSL237 are distant from the MCU board (separated by ~12 cm of wire), so I wouldn't expect the LED or sensor to be affected at all by heat from the MCU board, but I could be wrong!

Various effects determine the intensity of the light emitted by the IR LED: power supply voltage, LED current and LED temperature. So, you have a lot of possibilities to consider.

All good points! As I mentioned in my original post, a multimeter was not indicating that the voltage on the pin driving the LED was changing at all, but is it still possible the voltage/current could somehow be changing when the LED is actually connected to it?

A better option might be to use a spectral sensor, which directly converts light intensity in separate wavelength bands to counts.

Thanks for the recommendation! I agree with you - it does look like that sensor (or similar) would be a better option.

The Atmega328P should not get warm.
Is this an Arduino board or self designed?

I am using an Arduino Nano clone. According to the ATmega328P's internal temperature sensor, the MCU does warm up by about 4 C after power up. Here are example data, collected at the same time as the frequency readings I shared in my original post:

As you can see, the curve is almost identical to the frequency reading curve, which is what led me to believe that what I am seeing is somehow linked to MCU temperature. I just don't know how!

If you use a digital scope , make one pin Blink fast a few mSeconds and then measure the Period of the pulse to check if the clock drifts.

This is an excellent idea! Now I really wish I had an oscilloscope so I could try this!

Thank you again, all!

Map the two on the same graph.

The Y scales are wildly different so I can't very easily plot the curves on the same graph, but here they are side by side, in case that is helpful:

The curves are not identical, but if I do a simple linear regression of those two variables, R^2 = 0.89, which is a good indicator of how closely they correspond.

If you plug the + lead of a red led into an Uno GND and plug the - lead into A0 and read every so often, when illuminated by even house lighting it will read the forward V of the led if you wait long enough, the pin charges slowly and a single 1 uA read wipes that down. How frequently it fills halfway to Vf makes a nice analog red light meter.

It works by the photovoltaic principle, stronger light charges the pin faster and you can get IR leds. So it’s not lab quality, you can calibrate and you’re using an Uno?

Just BTW, using the same led to illuminate and detect ambient light level many times a second and dim the led to suit room brightness is a trick that Mitsubishi let out in a White Paper long ago. It also featured led to led serial data transmission between handheld devices 2” apart at moderate-low baud rates. That was in PDA’s back when.

Translate temp range of 47 to 51 into 0 to 100.
Translate freq range of 40880 to 41030 into 0 to 100.
Time will be the same.

Arduino has the map() function to do this.

A spreadsheet should be able to plot two sets of data on the same graph.

Just BTW, using the same led to illuminate and detect ambient light level many times a second and dim the led to suit room brightness is a trick that Mitsubishi let out in a White Paper long ago. It also featured led to led serial data transmission between handheld devices 2” apart at moderate-low baud rates. That was in PDA’s back when.

Interesting; thanks! An LED as a cheap light meter is a cool idea. I think what you describe about IR LED to IR LED data transmission was a feature of some of Palm's devices, IIRC?

Translate temp range of 47 to 51 into 0 to 100.
Translate freq range of 40880 to 41030 into 0 to 100.
Time will be the same.

True, I could scale the variables to plot them together, but then unit information is lost and I'm not sure it'd be much more informative than the visual comparison you can already do with the side-by-side graphs? Here is another option for plotting the two variables together on the same graph:

Here, you can easily see that the two variables are strongly linearly related, which the statistical analysis confirms: either variable makes an excellent predictor of the other.

Enjoy the wild goose chase!

Copy/paste the two sets of data against time in two columns on a spreadsheet (LibreOffice Calc/Microsoft Excel). DATA >> CHART

Its certainly strange, but I dont believe because there is some correlation between the graphs that that impies cause & effect. I think you need to look elsewhere.
I note the data sheet says the sensor is for uv and visible light, and you are using an (unspecified) IR LED.
I agree with
@jremington the resistor value is very large, and if the light output is low that would prejudice results in the presence of ambient light.
Traditionally the way to manage such interference is using a chopped signal to the led, and a lock in amplifier.

Perhaps you could provide a sketch to show the arrangement of source, sample and sensor and how ambient light is excluded?

Have you tested your frequency measurement system with known stable frequency?
You can use a 555 timer IC like this to generate a known signal frequency
https://www.allaboutcircuits.com/tools/555-timer-astable-circuit/

This should not have such a big effect.
For me ," hot" is what I can feel with my finger touching the Chip.
According to the Datasheet the Chip should run within specs with these below temps.

● Temperature range:
● Automotive temperature range: –40°C to +125°C
● Speed grade:
● 0 to 8MHz at 2.7 to 5.5V (automotive temperature range: –40°C to +125°C)
● 0 to 16MHz at 4.5 to 5.5V (automotive temperature range: –40°C to +125°C)

Copy/paste the two sets of data against time in two columns on a spreadsheet (LibreOffice Calc/Microsoft Excel). DATA >> CHART

I could certainly normalize the variables and plot them on the same graph, but it's not clear to me what that would reveal beyond the plots and statistics I've already shared, which unambiguously demonstrate a strong linear relationship between MCU temperature and frequency. I'm sorry if I'm missing something here!

You certainly are missing something, starting with the fact that a "strong correlation" proves nothing, and continuing by not considering more sensible alternatives.

I can't imagine why you are so stuck on this idea, but do have fun with the project!

I note the data sheet says the sensor is for uv and visible light, and you are using an (unspecified) IR LED. I agree with @jremington the resistor value is very large, and if the light output is low that would prejudice results in the presence of ambient light.

Perhaps you could provide a sketch to show the arrangement of source, sample and sensor and how ambient light is excluded?

The IR LED I am using is a Kingbright W53SF6C, which has peak output at 860 nm. Although the sensor is not designed for IR, it still has reasonable responsivity (~50%) at 860 nm and seems to work for this application.

The device I am building is based on this design which was published by Wijnen et al. in 2014. The wiring diagram at that link and housing pictures should help, I hope. The IR LED and light sensor are completely enclosed inside a chamber that excludes ambient light.