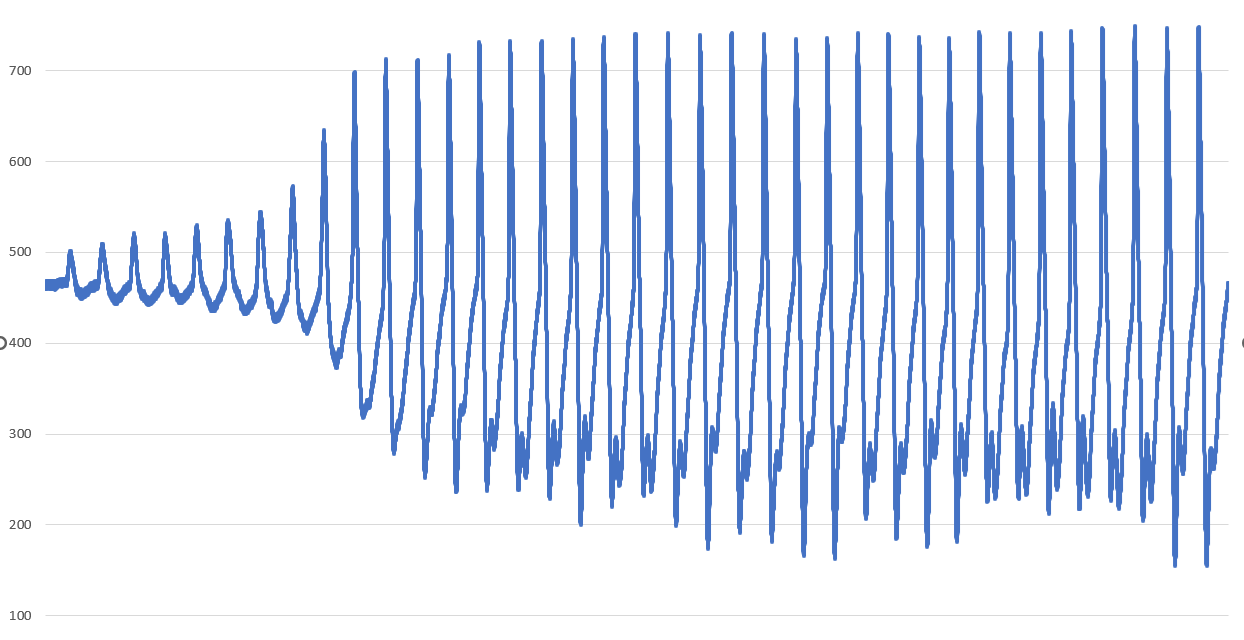
Does outcome 3 mean it may exceed the first peak value during these alleged periodic variations?
If a target value is known the problem is simple.
Is this a search for a relative (near) peak value? You would need to decide how long the signal should be stable, or nearly, before you declare a peak.
Like if the signal hasn't changed by +/- some tolerance X for some time Y, declare a peak value has been found.
X and Y to be determined by your unspecified goals.
Analog solutions might be easier, and an analog solution might be programmable as a digital solution.
An envelope detector followed by a rate-of-change circuit sort of thing, way above my pay grade but there are ppl around here who eat that kind of thing for breakfast.
The digital equivalent may be more or less the same as I first suggestion.
The sinusoidal nature seems to make necessary finding a new peak and comparing it to a previous peak, so as you described within a process like you described.
A negative value resets the local maximum mechanism. The next positive reading lower then the current local maximum marks the local peak, which should be compared to the previous candidate for global maximum.
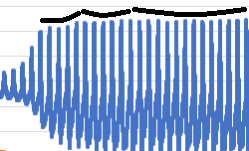
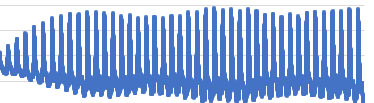
yes. But the variations aren't great. Even in this sample you can see the periodic variations if you look closely.
More easily visible here.
Target value as in expected Threshhold? We can't be sure of that.
That's the trouble, I don't know which logic to apply. An eye sees it, but I don't know how to mathematically do it. Sometimes it might be evident to the eye when to sine waves pass, sometimes when 5 or ten pass.
I'm inviting them for breakfast then.
Also, I'd like to solve this problem just through code if possible, without getting into additional hardware.
   if reading > previous, previous = reading
   else we found a local maximum
Then watch those local peaks in the same manner, viz:
   if local maximum > previous candidate, candidate is local maximum
   else previous candidate is the value sought
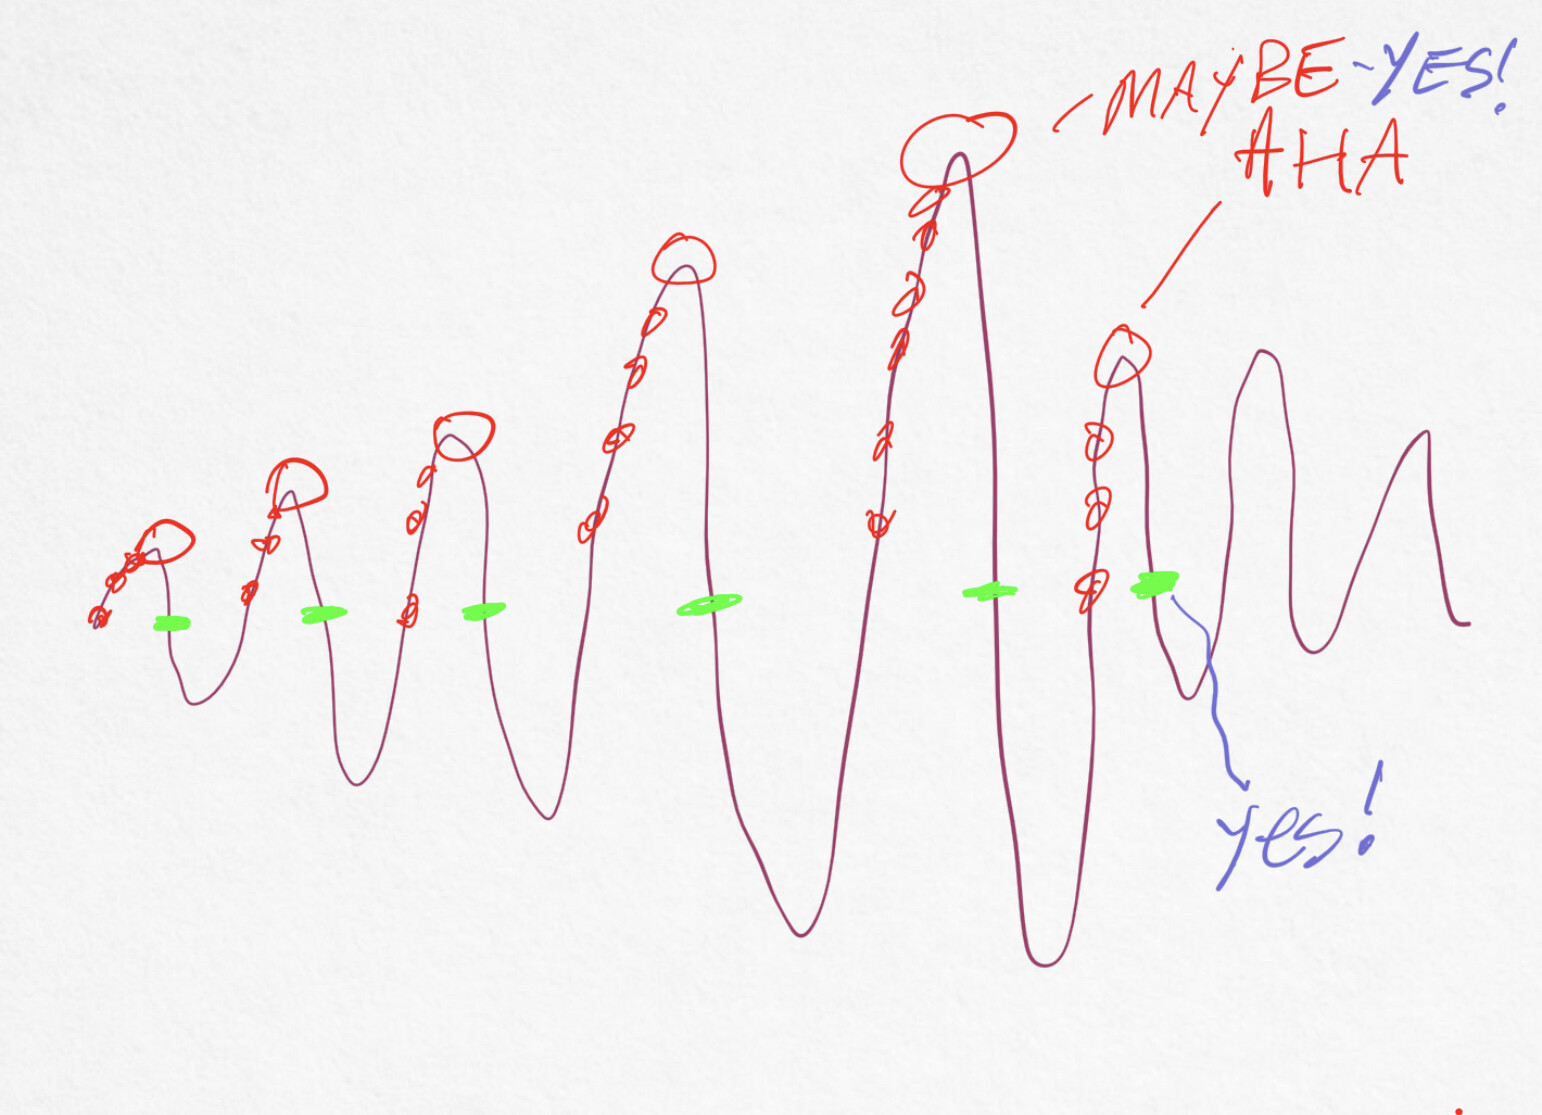
The green marks are for resetting the search for a local maximum. I used values less than zero to do that.
My hacking problems are all around startup and stopping. Which raises the question about how you intend to reset the entire thing for the next pass.
Sry. I'll maybe read and help from under the umbrella. And when I have time, I may try to figure out what I am talking about.
Looking at the diagram now I think you can conclude sooner than the green reset point. It is the first local maximum less than previous local maxima, you know right then AHA.
On your diagrams, which are/is the peaks/peak you want to detect and how soon do you want to make the decision?
Is there just one peak of interest in that diagram? Or is there more than one? Would you want triggers on each pulse bigger than the last peak? Or if just the one peak, would it reset and trigger again if the amplitudes of the peaks dropped back down by zero for a second or two?
How long/how small would a new maximum be before the previous peak isn't a peak of interest?
What does your eye see in the diagrams you've shown?
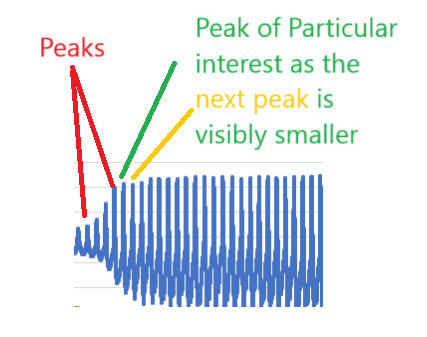
Below diagram marks which points I consider as peaks and which Peak is of interest.
There is just that one peak of interest in this diagram, which is the peak before the smaller peak. The moment this peak of interest is successfully identified the code should print its millis. The code would never reset until the code run is started again from scratch.
If you could "zoom in and enhance" that so the nature of the signal could be seen.
Is it nicely monotonic over the excursions from lowest to highest each sinusoidal section?
Is there noise to be filtered or ignored?
Are we sure that the local maximums (red circles on my chart) go up only until the place they go down which we are hoping is the beginning of the 1, 2 or 3 outcomes?
Never needing to reset other than real reset makes things easy but it makes me curious, so…
Now is my time to ask you what you up to and maybe say a bit more about your project. Just so we aren't X barking up a Y tree.
There is no noise, there is only signal in this waveform. Its from a sensor reading various biologic and bio-mechanical signatures (neural, cardiac, pulmonary, musculature etc etc) depending on application. The point of interest is identifying the moment when the waveform stabilizes.
In future I could need to identify not only the moment when the first time the amplitude peaks but also the consecutive times, but that's a problem for the future and possibly solvable in the same way we would solve the current problem.
Actually no, it often goes slightly low before rising again. If it helps I can share the data.
Squinting at this through the small window I several places where my simple approach could prematurely conclude that all your conditions for finding the desired value had been met.
4th peak - the upward going local max has now gone down. Are we done?
12th peak - same same.
Can you quantify and therefore filter/ignore smallish next differences in the local maxima?
Also and BTW can you say at least that the desired maximum is going to be at least 600, or any such fixed value?
What's the frequency (Kenneth)? How often do you think the samples can be taken? This may also be a problem since we are looking for something that only lasts no time...
I know that noise can issue trouble. This particular chart is from cardiac rate, and each periodic high and low marked in an earlier post with black curves is caused by pulmonary action. But if I don't try to catch that dip, what other option do I have to declare the waveform stabilised?
Dunno. You could let the algorithm find the peak peak, and keep finding it and then when some number in a row of the peak peaks are all within a percentage of each other call it stable.
I would be surprised if you read data from analog sensors without any noise (in the sense of unwanted influence due to body movement, environmental sound, etc.), especially if you use a resolution of 800 units ...
Even if that would be just a few units you would have to set some kind of threshold which difference should be determined as significant and which not.
Let us assume the following:
maxDiff = 5 // Maximum difference that is not significant
count // The number of subsequent peaks where the difference is below maxDiff
stableSig = ? // A value of count where the signal is considered to be "stable"
In that case you could
detect local peaks
compare each following peak with the previous one (difference, use abs() to get rid of the sign)
count how often the difference of subsequent peaks is within the threshold maxDiff
If (count >= stableSig) the signal is considered as "stable".
It might be a good idea to measure also the time difference between adjacent peaks to detect when the signal drops out.
Looks like the Peak of particular interest isn't much larger than the prior peak, so that difference (>=3% larger?) might give you a threshold to reserve judgement and update your candidate peak, and then you might identify or confirm the Peak of Particular Interest and alarm when the next peak is less than that (<3%) higher.
You might need another couple thresholds to filter out peaks less than a certain value, or to reset if it dips down well below visibly smaller, but those issues aren't in your question.
In a perfect world with a well-behaved signal, the idea I was hacking away at works fine.
FWIW, here is my sketch after the Umbrella Academy had a go at it. There's still a spurious report at reset time. Life too short to sort that, and this won't work for your signals anyway. Try it here:
// https://wokwi.com/projects/380383323394002945
// https://forum.arduino.cc/t/how-to-identify-moment-of-analog-sinusoidal-signal-peaking/1184837

int localMax;
int globalMax;

bool seenZero;

void setup() {
  Serial.begin(115200);
  Serial.println("hello there.");

  seenZero = false;
}

void loop() {
  delay(100); // whoa!
  int reading = analogRead(A0) - 512; // -512 to 512 then
  //  Serial.println(reading);

// first get the green marks point
  if (reading < 0) {
    if (!seenZero) {
      Serial.println("crossed zero going down");
      seenZero = true;

// bump globalMax if
      if (localMax > globalMax) {
        globalMax = localMax;
        Serial.print("new global max "); Serial.println(globalMax);
      }
      else { // test for
        Serial.print("SO IT WAS "); Serial.println(globalMax);
        globalMax = 0;  // reset for next cycle
      }
      localMax = 0;  // reset search for local maximum
    }
  }
  else /* reading >= 0 */ seenZero = false;

  if (reading > localMax) {
    Serial.print("new local max "); Serial.println(reading);
    localMax = reading;
  }
}
 I'm inviting them for breakfast then.