Hi, I am doing an project that involves calculating time interval between two consecutive peaks in an analog signal given as input to arduino (let's say sine wave). can anyone help me with the code ?
srikanth_ammineni:
Hi, I am doing an project that involves calculating time interval between two consecutive peaks in an analog signal given as input to arduino (let's say sine wave). can anyone help me with the code ?
Calculate the 'slope' from consecutive analogRead() measurements.
If the slope has been positive before and becomes negative then, you just passed a "top peak".
And if the slope has been negative before and becomes positive then, you just passed a "bottom peak".
Take the time of the "top peak" and "bottom peak" passses, then you can calculate the "time interval" from them.
Hi jurs, Thanks for replying. I already wrote the code for the logic you have said. But I couldn't get it work. Here's the code.
sample.ino (417 Bytes)
srikanth_ammineni:
Hi jurs, Thanks for replying. I already wrote the code for the logic you have said. But I couldn't get it work. Here's the code.
First you'd have to know what you want to get working.
Please let me know which interval you want to grab:
- full cylcle interval from "top peak" to "next top peak"
- full cylcle interval from "bottom peak" to "next bottom peak"
- half cycle interval from "top peak" until "bottom peak"
- half cycle interval from "bottom peak" until "top peak"
If you know what you want, you can start coding it.
How long do you expect the signal interval to be (roughly)? is it a few hundred microsonds? Several dozens of milliseconds? Seconds?
With a baud rate of 9600 you can send 960 characters per second to the serial monitor. So if the signal interval is very short, you probably cannot send every interval to Serial without slowing down the sketch, and will perhaps prefer to do averaging of interval times and only send 10 or so averaged interval values per second to Serial.
Would be better to know roughly about the interval time and whether it is microseonds, milliseconds or seconds, before you write some code.
You could get much better timing resolution and accuracy by doing your measurements from rising to rising zero-cross or falling to falling zero-cross and use micros() for time measurements.
The zero cross point has the highest rate of change of signal, the peaks have the lowest rate of change of signal (more time will expire between each ADC count) therefore more jitter and loss of stability in your results).
If the sinewave's zero crossing point is at 1/2 VCC, then the zero cross point is 512.
Why not read the time from 512 to 512?
This will be 1/2 cycle time.
Any rate of change approach detects local maxima. So if the waveform is complex, it will detect multiple peaks during every cycle.
I'm not sure if your peaks are all approximately at the same voltage, but if so, feed the analog signal to a comparator (1 op amp, a couple resistors) set up to change state very near the top value. Put the square wave output of the opamp into an interrupt pin, and time the intervals between interrupts.
Hi, I am doing an project that involves calculating time interval between two consecutive peaks in an analog signal given as input to arduino (let's say sine wave). can anyone help me with the code ?
Are you really working with a sine wave? Any more details of your project that would explain the requirement of measuring peak to peak time interval? Could you post an image of what the signal really looks like and/or describe its attributes like frequency, amplitude, distortion, harmonics, etc. Can't really help with code or much else with such a vague description.
dlloyd:
The zero cross point has the highest rate of change of signal, the peaks have the lowest rate of change of signal (more time will expire between each ADC count) therefore more jitter and loss of stability in your results).If the sinewave's zero crossing point is at 1/2 VCC, then the zero cross point is 512.
I think that the TO in this thread never told about the waveform, he just told about "analog signal".
Do you have additional information?
You assume that the "analog signal" might be a sine or cosine, but from the telling of the TO it might be a square wave, triangle wave or irregular shaped waveform as well.
OP, your code should probably work at detecting local maxima, as I pointed out in reply #6. But if you have a complex waveform, your method will not find what is normally considered the peak. The peak value would normally be defined as the maximum value between two adjacent zero crossings. That would be coded differently. It would not be very hard, as you can imagine.
My cheap-o-scope does this. the alogrythim is not real sophisticated, so it may not work for you. Basically i find the rise of a wave, the find the next rise. i measure the time between the two and compute frequency.
this Youtube video shows the code in action, and there's a link to the source code in the video's description.

Hope this helps.
Kris
Look at an op amp peak detector implementation to see how it's done.
I would try a current limiting resistor (<=1mA pin current) between AC source and an analogue pin.
Assuming the AC signal has a low output impedance, and is ground referred.
Anything "positive" will have an A/D value >0
Anything negative will have an A/D value of 0
This, with default Aref, will have a ~5mV threshold. Use the internal Aref to reduce that to ~1mV.
Leo..
Wawa ... now that's a bit too easy +1
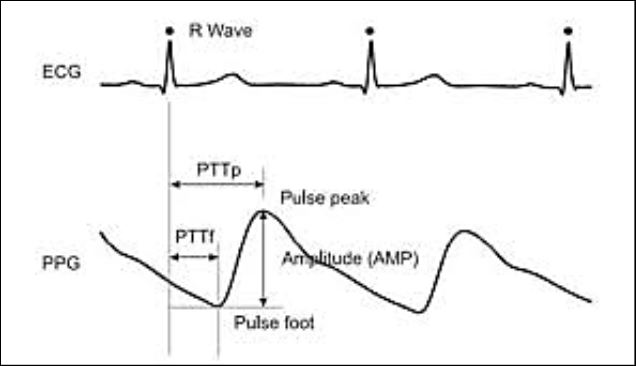
Hello everyone,Thanks for your suggestions. This project involves calculating Pulse Transit time from ECG and PPG. I've attached an image for your reference.
As some of you said,To detect peaks using slope calculation. But for an sine wave it works but for an ECG signal local maximums might be there. So it kind of becomes a problem.
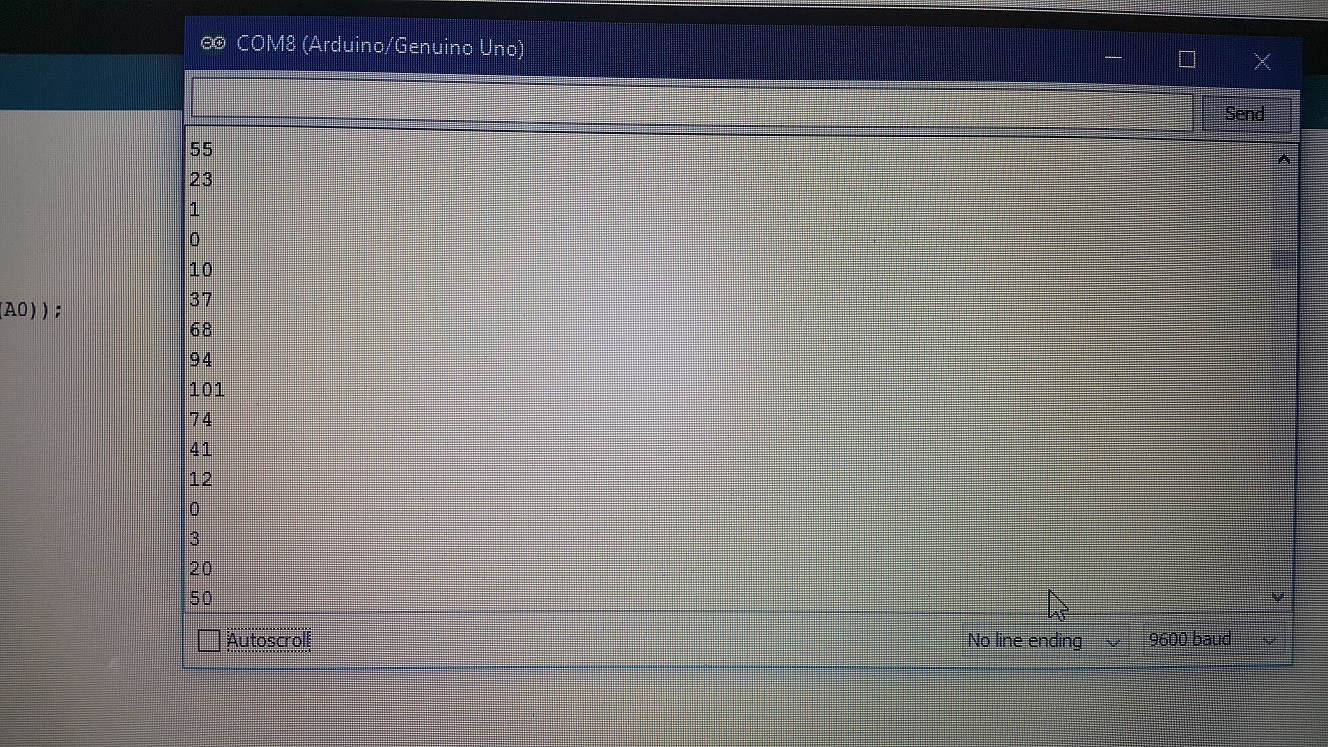
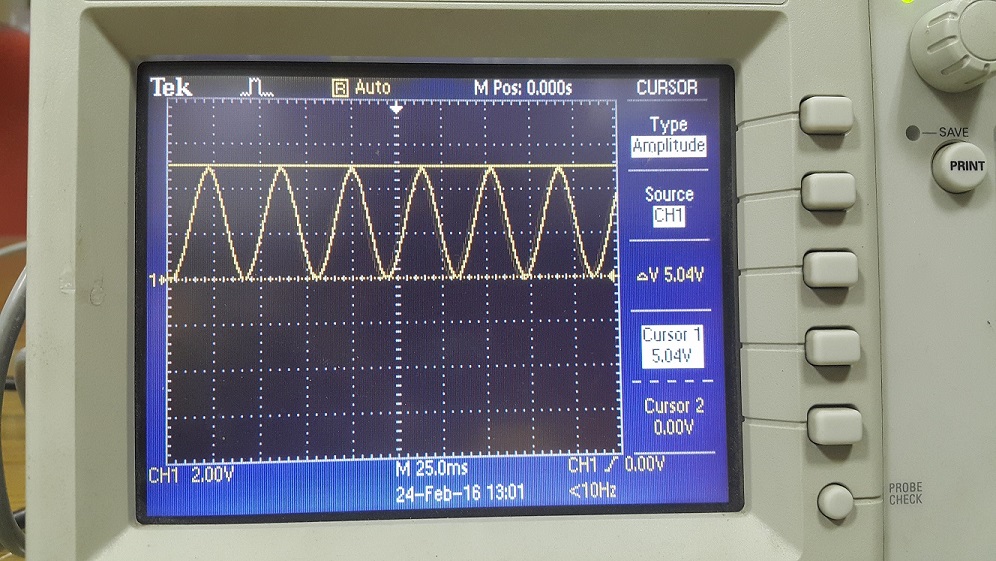
and some said to calculate interval between zero crossings i.e from 512 to 512. For that when a sine wave of 5V is given, serial monitor shows only values between 0 and 100. It has to show between 0 and 1023 right ? I've attached the code, Input signal and serial monitor output. Please check it out.
sample.ino (92 Bytes)

sample.ino (92 Bytes)
sample.ino (92 Bytes)
sample.ino (92 Bytes)

sample.ino (92 Bytes)
srikanth_ammineni:
Please check it out.
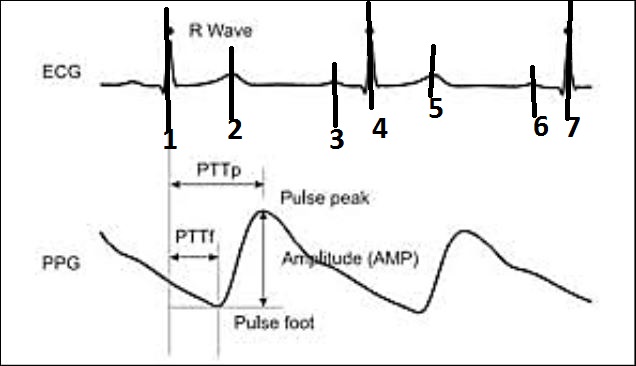
I think you have to be more precise about the "peaks".
I have taken one of your pictures PTT.jpg and edited it a little bit: I included all the peaks I could see in the curve and numbered the peaks 1, 2, 3, 4, 5, 6, 7.
Here is the edited picture with some peak numbering.
I think there is also two different types of signals presented in that picture: "ECG and PPG
You want evaluations about two different curves, which are measured in parallel?
So if you want to get results for the time from peak to peak, you possibly will have to tell about the time between which peaks you mean.
Peak-1 and Peak-2?
Peak-2 and `Peak-3?
Peak-3 and Peak-4?
Peak-4 and Peak-5?
Peak-5 and Peak--6?
Peak-6 and Peak-7?
Or maybe peak-1 and peak-4?
Or peak-4 and peak-7?
Or maybe times from two different curves taken, such like starting time is peak-1 from curve ECG, and you want to have the time until in the second curve PPG the point marked "Pulse Peak" has come?
There is a lot of local "peaks" in your two signals, and you clearly will have to define what you want. If you are unable to describe it precisely, nobody will be able to find it.
The more complicated it gets, and the more different curves with a lot of peaks you have and want to combine, the more complicated the evaluation will become.
Your signal looks quite clean, repetitive and has adequate amplitude for detection. If you're only interested in measuring the time interval between each cycle, then the time interval at the "zero" crossing (mid-point) would be the same as the time interval between peak-peak.
Using the analog input will limit how accurate your measurements be as you may only achieve millisecond resolution as you would be polling to get readings. Much better timing resolution could be had by an external op-amp/comparator circuit and using a digital interrupt. Also, Arduino's built in comparator is very fast and can provide an interrupt for accurate time measurements.
For testing, here's a circuit that would capacitive couple your signal to 2.5V (ADC value of 512). Could use lower tolerance resistors 1% or 5% knowing how much this could effect the midpoint voltage. Then you could choose a detection level in software like this:
void loop() {
  val = analogRead(A0);
  if (val > 550 && previousVal <= 550) {
    // impulse detected ... record time micros()
  }
}
Hi, I am wondering if you can upload your code.
srikanth_ammineni:
Hello everyone,Thanks for your suggestions. This project involves calculating Pulse Transit time from ECG and PPG. I've attached an image for your reference.As some of you said,To detect peaks using slope calculation. But for an sine wave it works but for an ECG signal local maximums might be there. So it kind of becomes a problem.
and some said to calculate interval between zero crossings i.e from 512 to 512. For that when a sine wave of 5V is given, serial monitor shows only values between 0 and 100. It has to show between 0 and 1023 right ? I've attached the code, Input signal and serial monitor output. Please check it out.
This would have been very good info to have in the first post, instead of just saying "like a sine wave". If you aren't interested in measuring a sine wave, don't ask about one.
As was pointed out by a few people here, "peak" for a complex periodic signal is ambiguous. You need to be very clear about exactly what features you are looking to detect.
For the ECG, it's clear that what you're looking to detect is not all the local maxima, but the infrequent large spikes. For those, there are two salient features that can be detected: the slope and the amplitude.
One method (to detect the steep slope) is to differentiate the signal (calculus) and detect when the slope goes above a certain threshold value. Then you measure the time different between the slope threshold crossings.
A second method (to detect the large amplitude) is to use a low pass filter with a long time constant to track the average value of the wave, and set a threshold level a certain amount above the average. Use the transitions above that threshold to calculate the period between spikes.
The second method is used by capacitive touch sensors to compensate for the normal changes in a touch pad's capacitance that happens as temperature and humidity change over long periods of time. A touch of several seconds long registers as a very brief spike when compared to the hours it can take for ambient conditions to drift.