New to Arduino. I have an UNO. Purchased a heart rate sensor and now can read my pulse (with a flashing red light signal only). Trying to build a simple heart measuring device to track HRV. I would like to read the time value between the heartbeats and create a graph on my LCD with an accompanying sound. If someone could point me in the right direction I would be most grateful.
Considering the graph you want to display:
- If you have interval between heart beats on the y axis, the faster the pulse, the lower the curve on the graph. Probably nicer would be pulse rate which would be the inverse.
- If the x axis shows time, how much history do you want to display? A few minutes? or maybe the last few beats ?
What display are you using? Post a link to it.
Pulse from pulsewave does not give HRV from ECG. Just to keep in mind.
Thanks for replies! I want to create a graph line similar to this attached, by accurately measuring the space of time between the beats for the X axis, over time the Y axis.
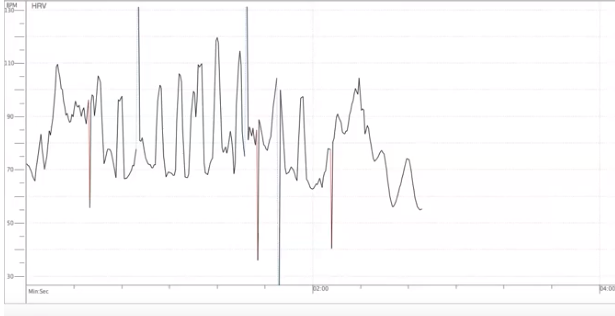
6v6gt, ah, I see what you mean about the interval between and yes it would be measuring the pulse rate.
Ok, but a 1602 display is not suitable for displaying a graph.