MKR Zero Debugging Not Working

I just purchased a MKR Zero board. Arduino's own documentation specifically says that debugging works on this board without the need for any external hardware. Here is the link to where this is said: https://docs.arduino.cc/software/ide-v2/tutorials/ide-v2-debugger/

I keep getting this error:

Open On-Chip Debugger 0.10.0+dev-gf0767a31 (2018-06-11-13:36)
Licensed under GNU GPL v2
For bug reports, read
        http://openocd.org/doc/doxygen/bugs.html
CDRTOSConfigure
Info : auto-selecting first available session transport "swd". To override use 'transport select <transport>'.
none separate
adapter speed: 400 kHz
cortex_m reset_config sysresetreq
Info : Listening on port 50001 for tcl connections
Info : Listening on port 50002 for telnet connections
Error: unable to find CMSIS-DAP device

[2024-10-13T04:36:01.334Z] SERVER CONSOLE DEBUG: onBackendConnect: gdb-server session closed
GDB server session ended. This terminal will be reused, waiting for next session to start...

I am following all the instructions for debugging in this document in the same link above.

What do I need to do to make this work?

Any help is very much appreciated.

I am not new to embedded hardware and programming, but I am completely new to Arduino and the Arduino ecosystem.

Thank you.
David

Hi @ee-llc.

You misread the tutorial. It is the Zero board that has the on-board debug probe. Despite the similar name, the MKR Zero is a significantly different board from the Zero. The MKR Zero does not have an on-board debug probe so it is necessary to connect a debug probe between your computer and the SWD pads on the bottom of the board:

MKR SWD

I can recommend the "DAPLink" debug probe as one that will work with Arduino IDE and the MKR Zero board and is available for a very reasonable price. You can find the Chinese manufactured versions of these probes on the usual online marketplaces (Amazon, eBay, etc.).

The DAPLink is open source hardware so it is also theoretically possible to make a DIY one:

Hello ptillisch,

I appreciate the help.

I just took a closer look at the documentation for the Zero versus the MKR Zero and I see what you mean. I did not catch this when I purchased the board as I looked at the IDE documentation first...and made a quick, but wrong decision...

I do have a Segger J-Link debugger, and I just reviewed the Arduino documentation on using that.

Thank you for the marked up picture of the pads on the MKR Zero board given there is no silkscreen markings for these pads.

I'll try connecting the J-Link, and I'll reach out if I have any problems with that.

Thank you again.
David

You are welcome. I'm glad if I was able to be of assistance.

Well, the MKR Zero is actually a very nice board. I really like the compact and breadboard-friendly MKR board form factor and it is actually kind of nice to have a minimal design that is just that sweet ATSAMD21G18 microcontroller and the necessary support circuitry, without a bunch of other components added it (well, there is the SD socket on the board, but that is fairly non-obtrusive).

Hello ptillisch,

I am having another issue....

I have 3 computers for my electrical engineering consulting business, a windows 10, and two windows 7. I still use the windows 7 machines given all the applications loaded on them and the test & measurement, and embedded programming infrastructure I have set up that they are a critical part of. As for security they are behind my firewall so this is not a concern.

I have been playing with the MKR Zero board on all three computers, using only the built-in blink example code under examples. On the Win10 machine everything works fine, in both the latest version of the IDE, and V1.8.19 which is the last version that will run on Win7. This is the machine I want to take advantage of the IDE V2 debugger capability.

On the Win7 machines, I was able to get things to work one time, and now I have the same problem with both machines where I can't program. They both show the same results:

Forcing reset using 1200bps open/close on port COM3
PORTS {COM3, } / {COM3, } => {}
Uploading using selected port: COM3
C:\Users\xxxxxxx\AppData\Local\Arduino15\packages\arduino\tools\bossac\1.7.0-arduino3/bossac.exe -i -d --port=COM3 -U true -i -e -w -v C:\Users\xxxxx\AppData\Local\Temp\arduino_build_561379/Blink.ino.bin -R 
Send auto-baud
No device found on COM3
Set binary mode
An error occurred while uploading the sketch

Sometimes the COM port number will be different.

I have gone through some of the posts on this forum, and I have tried double tapping the reset button on the MKR Zero board, and while this will sometimes initiate a new COM port number, it still will not work when I go back into the port settings and select that number.

On both machines I have tried uninstalling and re-installing the IDE, I have tried uninstalling and re-installing the drivers, Nothing works.

I cannot understand why it worked initially on both machines, and why it won't now.

Again, it works fine on the Win10 machine, so I know the MKR Zero board itself is fine.

On both machines I can program an old Adafruit Trinket board that I had laying around, that came from some project where I got stuff back from a client and it was in the box. I never used it until now. Again, this thing will work on these machines (and the Win10 machine), but I can no longer get the MKR Zero to work on these machines and I need to for a project.

Am I missing anything? Any suggestions? Unfortunately I'll need to move away from Arduino If I can't get this to work. It seemed like this all would be a simple and fast approach for what I need to do on this new project, but it's not looking that way at the moment...

Thank you.
David

I just tried completely uninstalling the program again, and deleting the Arduino15 folder in Users...AppData...Local, but that did not work either. I deleted that folder after I noticed that uninstalling the program did not remove everything. Is there another place where state data is retained, and it might possibly be corrupt?

The little trinket board works just fine with this "new" installation, but I still cannot get the MKR Zero board to program. It connects, and I can retrieve the board info, but it keeps failing the programming and the problem continues to be it's not connecting to the COM port and I cannot figure out what the problem is...Again the Win10 machine is fine.

My understanding is this all should work fine in Windows 7 Professional, 64-Bit. Is that correct, or has the MKR Zero board always been a problem with Win7?

Thank you.
David

I just gave it a try on my Windows 7 machine and was able to upload to the board.

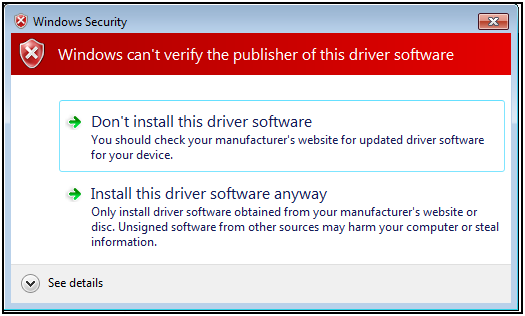
I did notice that, during the driver installation process that happens when you install the "Arduino SAMD Boards (32-bits ARM Cortex-M0+)" platform via the Arduino IDE Boards Manager, there was a "Windows can't verify the publisher of this driver software" warning:

image

I clicked the "Install this driver software anyway" and the board was recognized correctly by Windows after that.

Please post the output from performing an upload when the board is in this state:

  1. Press and release the reset button on your board quickly twice.
    The LED marked "L" on the board should now start pulsing.
  2. Select the port of your board from the Tools > Port menu in Arduino IDE.
    :exclamation: As you noticed, using the double reset to activate the bootloader will often cause the serial port number of the board to change, so don't assume you already have the correct port selected from the menu.
  3. Start an upload in Arduino IDE.
  4. Wait for the upload to fail.
  5. You will see an "Upload error: ..." notification at the bottom right corner of the Arduino IDE window. Click the "COPY ERROR MESSAGES" button on that notification.
  6. Open a forum reply here by clicking the "Reply" button.
  7. Click the <CODE/> icon on the post composer toolbar.
    This will add the forum's code block markup (```) to your reply to make sure the error messages are correctly formatted.
    Code block icon on toolbar
  8. Press the Ctrl+V keyboard shortcut (Command+V for macOS users).
    This will paste the error output from the upload into the code block.
  9. Move the cursor outside of the code block markup before you add any additional text to your reply.
  10. Click the "Reply" button to post the output.

Hi ptillisch,

After some digging on google, and the Arduino forum, I learned from others that the problem seems to be with Windows 7 and USB, and it's not consistent.

Here is what I figured out: I am not crazy...at least this one time. I thought I was because things seemed to work initially and then they didn't. It had me thinking maybe I imagined it worked... I now have it installed on three windows 7 machines.

Machine 1 --> Works if the MKR Zero is plugged into a USB hub, but I still have to double tap the reset button each time to program, and then select the new COM port assigned.

Machine 2 --> Works just fine if plugged into one of the USB-C ports, has problems if plugged into a USB-A port on the machine.

Machine 3 --> Works fine if plugged into a USB hub, and I don't have to keep double-tapping the reset button, it just works. If plugged directly into one of the machine's USB-A ports (older machine, only has USB-A) directly then I have problems.

When I tried it on the first two machines, I think I got lucky in where I was plugging into the first time it worked, but then I obviously did not correlate where I was plugging into and the problem I was having...

On all three I did get the pop-up you mentioned, and I allowed the sw to be installed.

On the Windows 10 machine, running the V2 debugger, I did get the Segger J-Link connected to the MKR Zero and I have debugging working . The marked-up picture you sent me was very helpful because the Arduino document:

https://docs.arduino.cc/tutorials/mkr-wifi-1010/mkr-jlink-setup/

is incorrect in showing the connections. It has the Reset line going to pin 17 instead of pin 15 on the J-Link's connector. Pin 17 is not used in SWD mode. It might be good to update this document with the correct info.

I'm sure I would have figured this out after it didn't work, and I pulled up my J-Link documentation to sort out why, but your marked up picture saved me the time. I could see right away that document was incorrect.

While the debugging is a bit crude relative to higher end commercial IDE packages, it's definitely helpful, and for what I need to to it's probably good enough.

I do have a question around debugging. I started by playing with a simple built in LED blink program on the MKR Zero. In the debug window, in the messages that come up during active debugging, there is this one:

Cortex-Debug: VSCode debugger extension version 1.5.1 git(be7d3c8+dirty). Usaage info: https://github.com/Marus/cortex-debug#usage
    IMPORTANT: Set "showDevDebugOutput": "raw" in "launch.json" to see verbose GDB transactions here. Very helpful to debug issues or report problems
    Please check TERMINAL tab (gdb-server) for output from C:/Program Files/SEGGER/JLink_V810b/JLinkGDBServerCL
Resetting target

Where do I find the "launch.json" file in order to change the setting as suggested, so I see the verbose GDB transactions?

Thank you for the help.
David

I realize this response is far to much delayed to help you, but I saw this forum topic while doing some investigations into the subject today and thought I would answer the question in case it might be useful to others who have the same question and find this during their research.

It is important to understand that the "issues" they message is referring to are issues in the debugger system, not issues with the sketch project.

The verbose output that will be produced by enabling this setting is likely to be quite cryptic, but it might be useful for troubleshooting certain problems with the debugger, especially for an advanced user who is familiar with the workings of the system.

Using debug_custom.json

As you learned when setting up for debugging with the J-Link debug probe, it is possible to customize the configuration of the Arduino IDE sketch debugger via a file named debug_custom.json which is placed in the sketch folder.

This is the only way to make persistent customizations to the debugger configuration. So you should use this approach in the case where you want to use the customized configuration for every debug session.

  1. Open the sketch for which you want to configure the debugger in Arduino IDE.
    The configuration is applied on a per-sketch basis.
  2. Select the target board in Arduino IDE, and make any other necessary configurations via the submenus under Arduino IDE's "Tools" menu (e.g., selecting the debug probe type from the Tools > Programmer menu).
  3. Start the debugger by clicking the "Start Debugging" button on the Arduino IDE toolbar, as usual.
    Arduino IDE will begin the process of initializing the debugger.
  4. Wait for the debugger to be initialized, as indicated by a change of color of the status bar at the bottom of the Arduino IDE window, and the appearance of the "Debug Console" view in the bottom panel.
    This can take several seconds to occur.
  5. Click the stop icon in the "DEBUG" view (a debug session is automatically started by clicking the "Start Debugging" button on the Arduino IDE toolbar).
  6. Click the :gear: icon ("Open launch.json") in the "DEBUG" view.
    A "launch.json" editor tab will open in Arduino IDE. This is the launch configuration file that is actually used by the debugger (stored in a temporary folder separate from the sketch).
  7. Copy the value of the configId key (e.g., arduino:samd:mkrzero:programmer=jlink) from the content in the "launch.json" editor tab.
  8. Click the ●●● icon at the right side of Arduino IDE's editor tab bar.
    A menu will open.
  9. Select "New Tab" from the menu.
    The "Name for new file" dialog will open.
  10. Type debug_custom.json in the field in the dialog.
  11. Click the "OK" button in the dialog.
    A new "debug_custom.json" editor tab will open in Arduino IDE.
  12. Add the following content to the "debug_custom.json" editor
    [
      {
        "configId": "<configuration ID>"
      }
    ]
    
  13. Replace the <configuration ID> placeholder with the value you copied at step 7 of these instructions.
  14. Add the custom configuration items in the object.
    For example, if the configuration ID is arduino:samd:mkrzero:programmer=jlink and you wanted to set the showDevDebugOutput configuration key to raw, the content of debug_custom.json would look like this:
    [
      {
        "configId": "arduino:samd:mkrzero:programmer=jlink",
        "showDevDebugOutput": "raw"
      }
    ]
    
  15. Select File > Save from the Arduino IDE menus.
    You can skip this step if you have Arduino IDE's "Auto save" feature enabled.
  16. Start the debugger by clicking the "Start Debugging" button on the Arduino IDE toolbar.
    :exclamation: You must click this button in order for any custom configuration made via debug_custom.json to take effect. They will not be loaded if you only click the the play icon ("Start Debugging") in the "DEBUG" view to start the debugger.

If you check the "launch.json" editor tab, you will now see that the configuration from debug_custom.json have been merged into the configuration with the matching configId value (both files can contain multiple configurations).

Using launch.json

The debugger is configured by a "launch configuration" file named launch.json which is automatically generated by Arduino IDE.

This file is stored in a temporary folder which may be cleared at any time, and the relevant configuration in it is overwritten each time you click the "Start Debugging" button on the Arduino IDE toolbar. So editing this file is not an effective way of making persistent modifications to the debugger configuration. However, changes made to the launch configuration in this file take effect as soon as you click the play icon ("Start Debugging") in the "DEBUG" view (which is a much faster way to start the debugger than the "Start Debugging" button on the Arduino IDE toolbar). So editing this file is a convenient way make temporary configuration adjustments during a debug session, or for developing configurations in preparation for saving the final version in the debug_custom.json file.

  1. Select the target board in Arduino IDE, and make any other necessary configurations via the submenus under Arduino IDE's "Tools" menu (e.g., selecting the debug probe type from the Tools > Programmer menu).
  2. Start the debugger by clicking the "Start Debugging" button on the Arduino IDE toolbar, as usual.
    Arduino IDE will begin the process of initializing the debugger.
  3. Wait for the debugger to be initialized, as indicated by a change of color of the status bar at the bottom of the Arduino IDE window, and the appearance of the "Debug Console" view in the bottom panel.
    This can take several seconds to occur.
  4. Click the stop icon in the "DEBUG" view (a debug session is automatically started by clicking the "Start Debugging" button on the Arduino IDE toolbar).
  5. Click the :gear: icon ("Open launch.json") in the "DEBUG" view.
    A "launch.json" editor tab will open in Arduino IDE. This is the launch configuration file that is actually used by the debugger (stored in a temporary folder separate from the sketch).
  6. Select File > Preferences... (or Arduino IDE > Settings... for macOS users) from the Arduino IDE menus.
    The "Preferences" dialog will open.
  7. Check the box next to Auto save.
    This is required because there is no way to manually trigger a save of changes to the launch.json file since it is located outside the sketch folder (manually triggered saves only save the sketch).
  8. Click the "OK" button.
    The "Preferences" dialog will close.
  9. Make the desired modifications to launch.json.
  10. If you added a new launch configuration, select it from the menu in the "DEBUG" view (it will be automatically added to the menu).
  11. Click the play icon ("Start Debugging") in the "DEBUG" view.
    A debug session will start, configured according to your modified launch configuration.