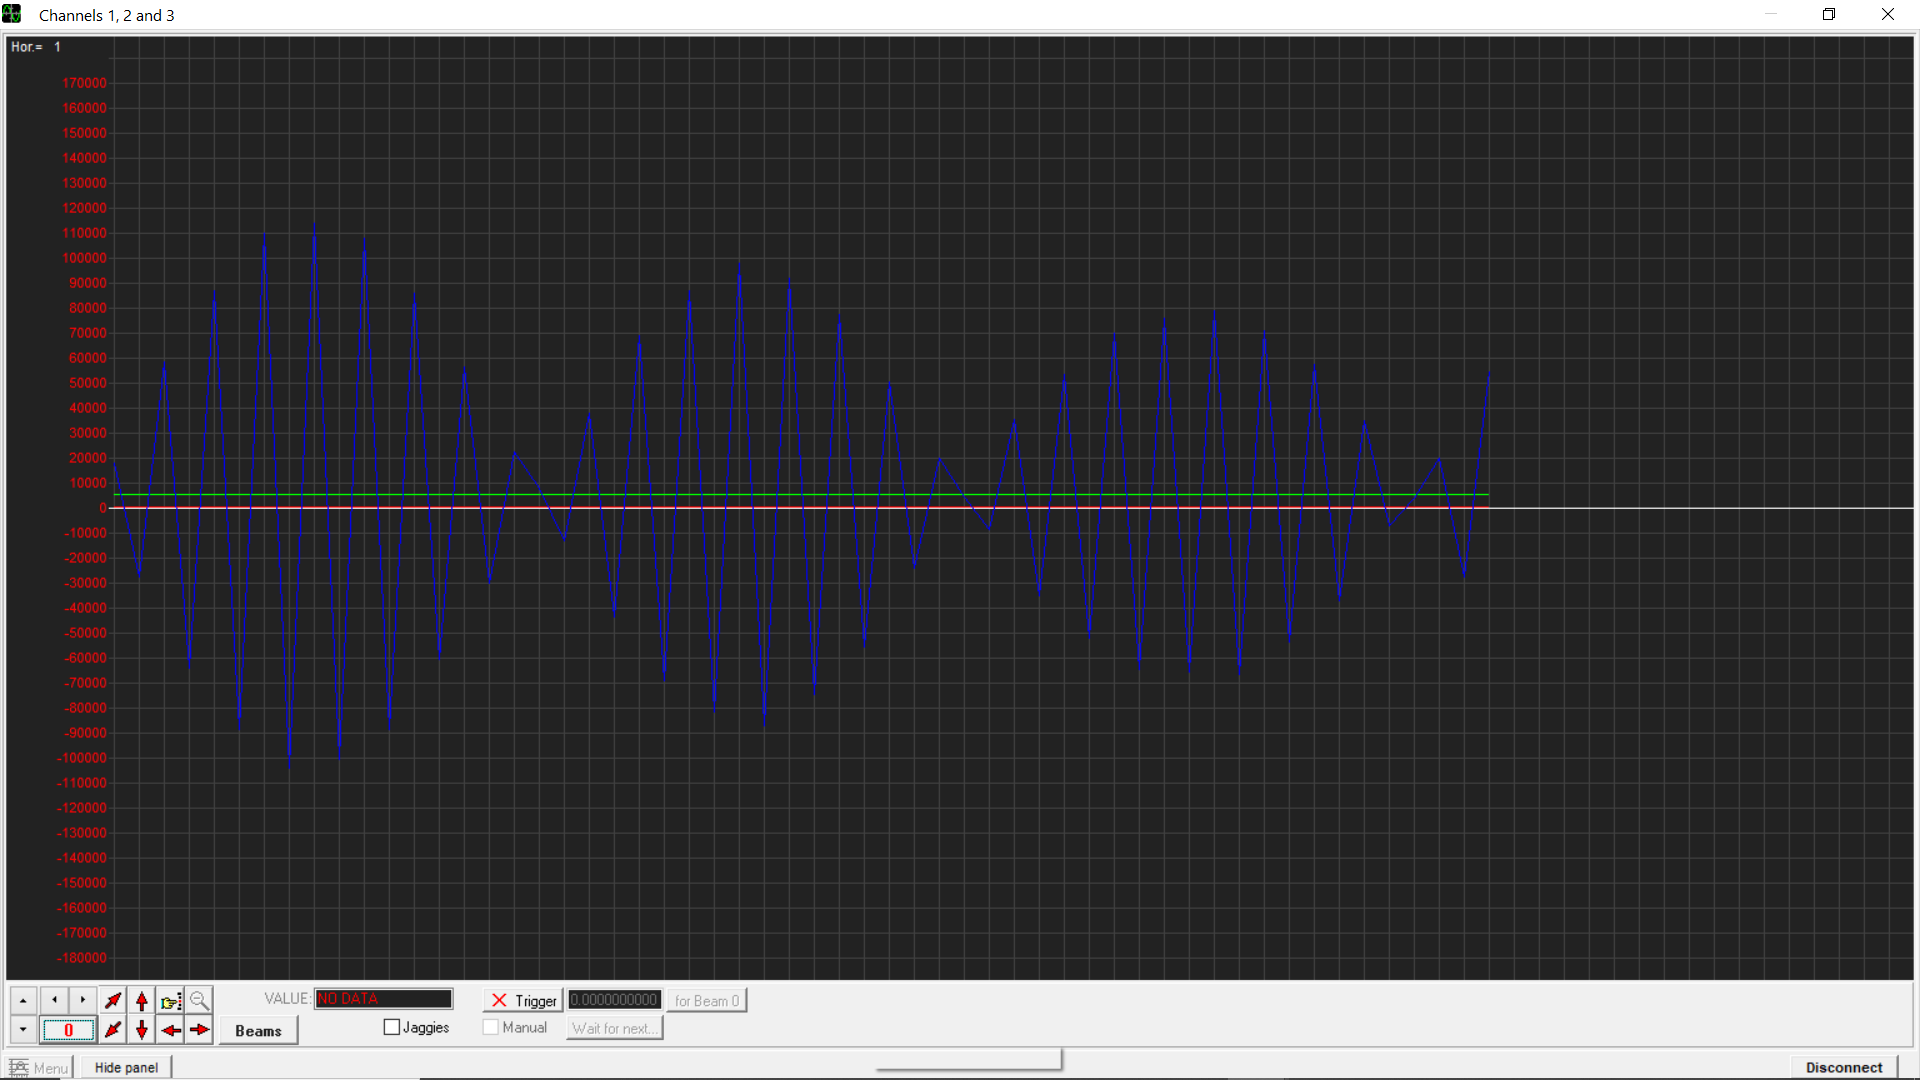
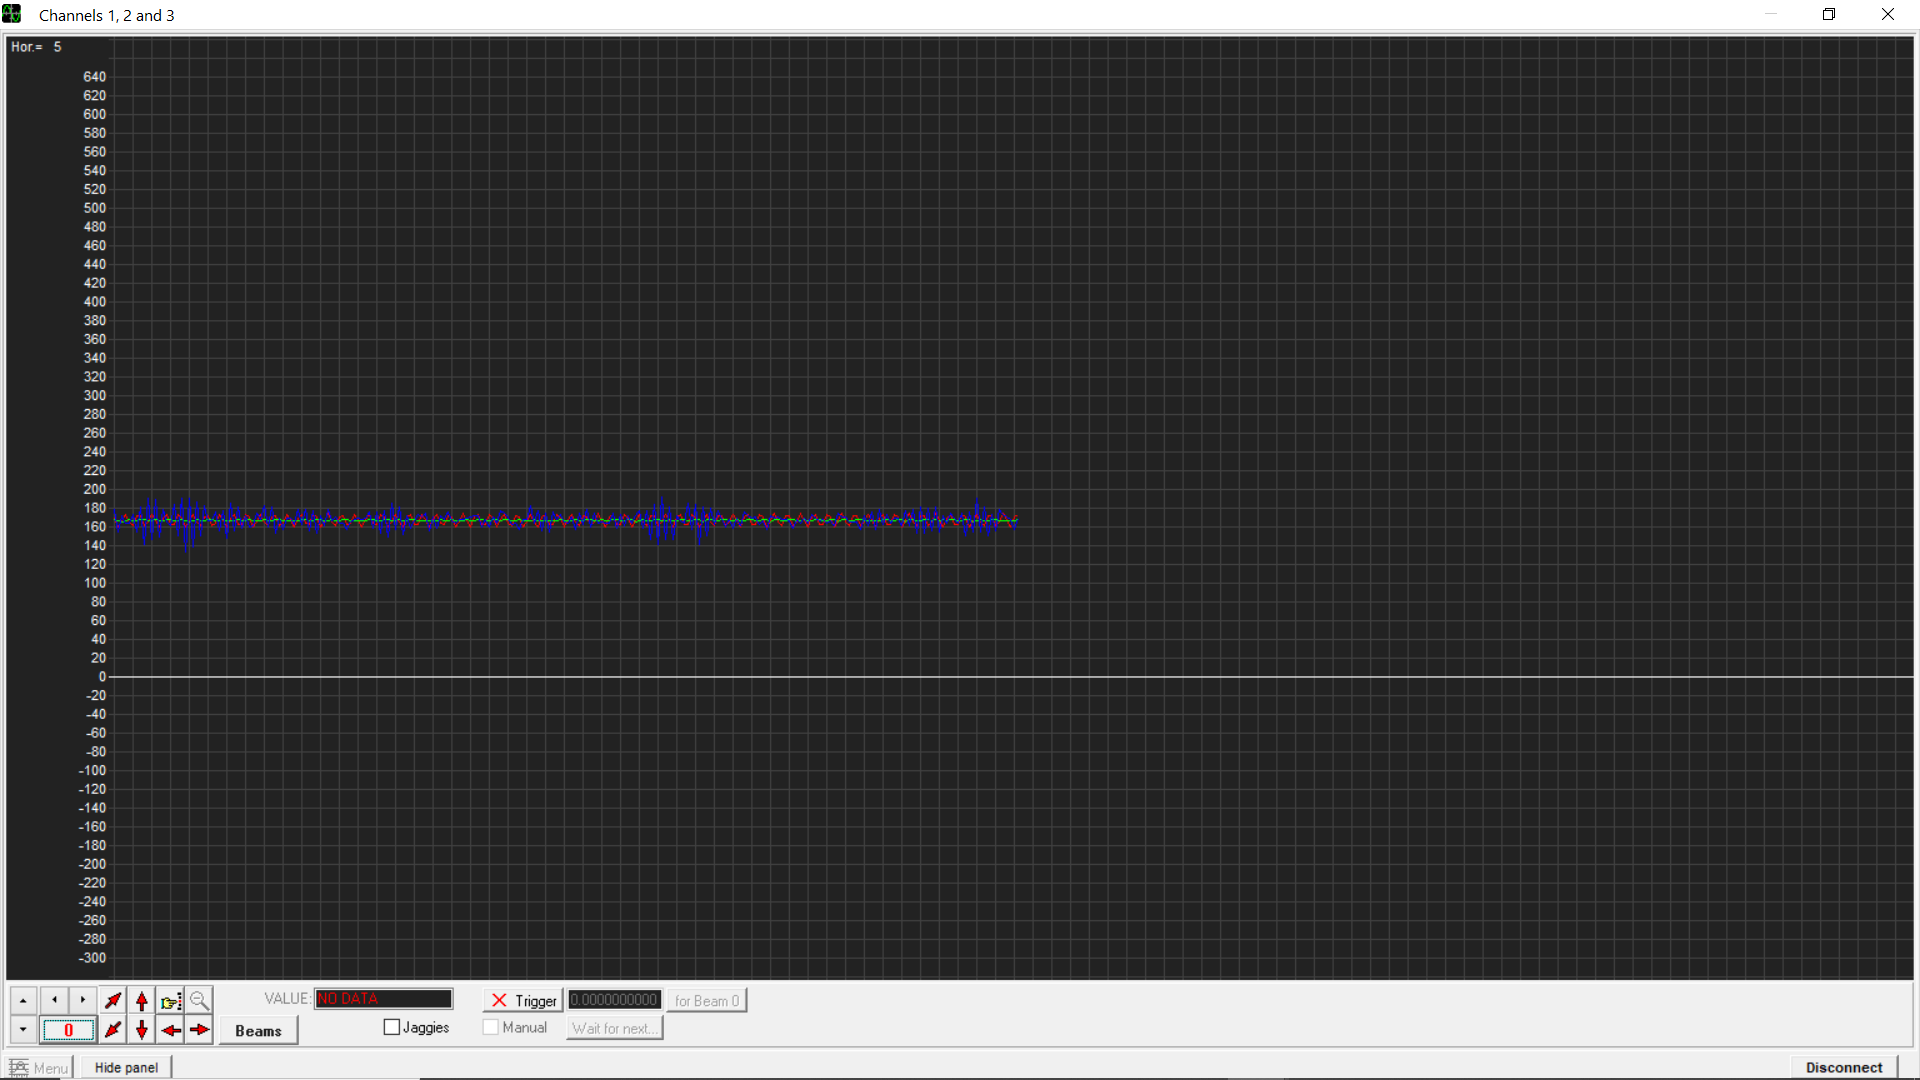
Thanks again. I tried to implement the filter using the FIR Filter Arduino Library. Tests showed that the library seems to be working correctly using the examples with some real-time data. When I tried the filter from tfilter, I got an interesting 'enveloped' output with an amplitude of +/- 10E5 at steady state (see attachment), and +/-10E6 if waving. This is for 10-bit input data with 10 count noise @50Hz. See attached sketch and plot.
The time to process each data point was only 20us which I hope is correct (on a Mega2560). Can you recommend good filter design resources? I see this is a deep subject with lots of hits on google. I am also interested to try fft, this sounds more promising. Thanks.
ALS-PT19_test_sketch.ino (1.6 KB)
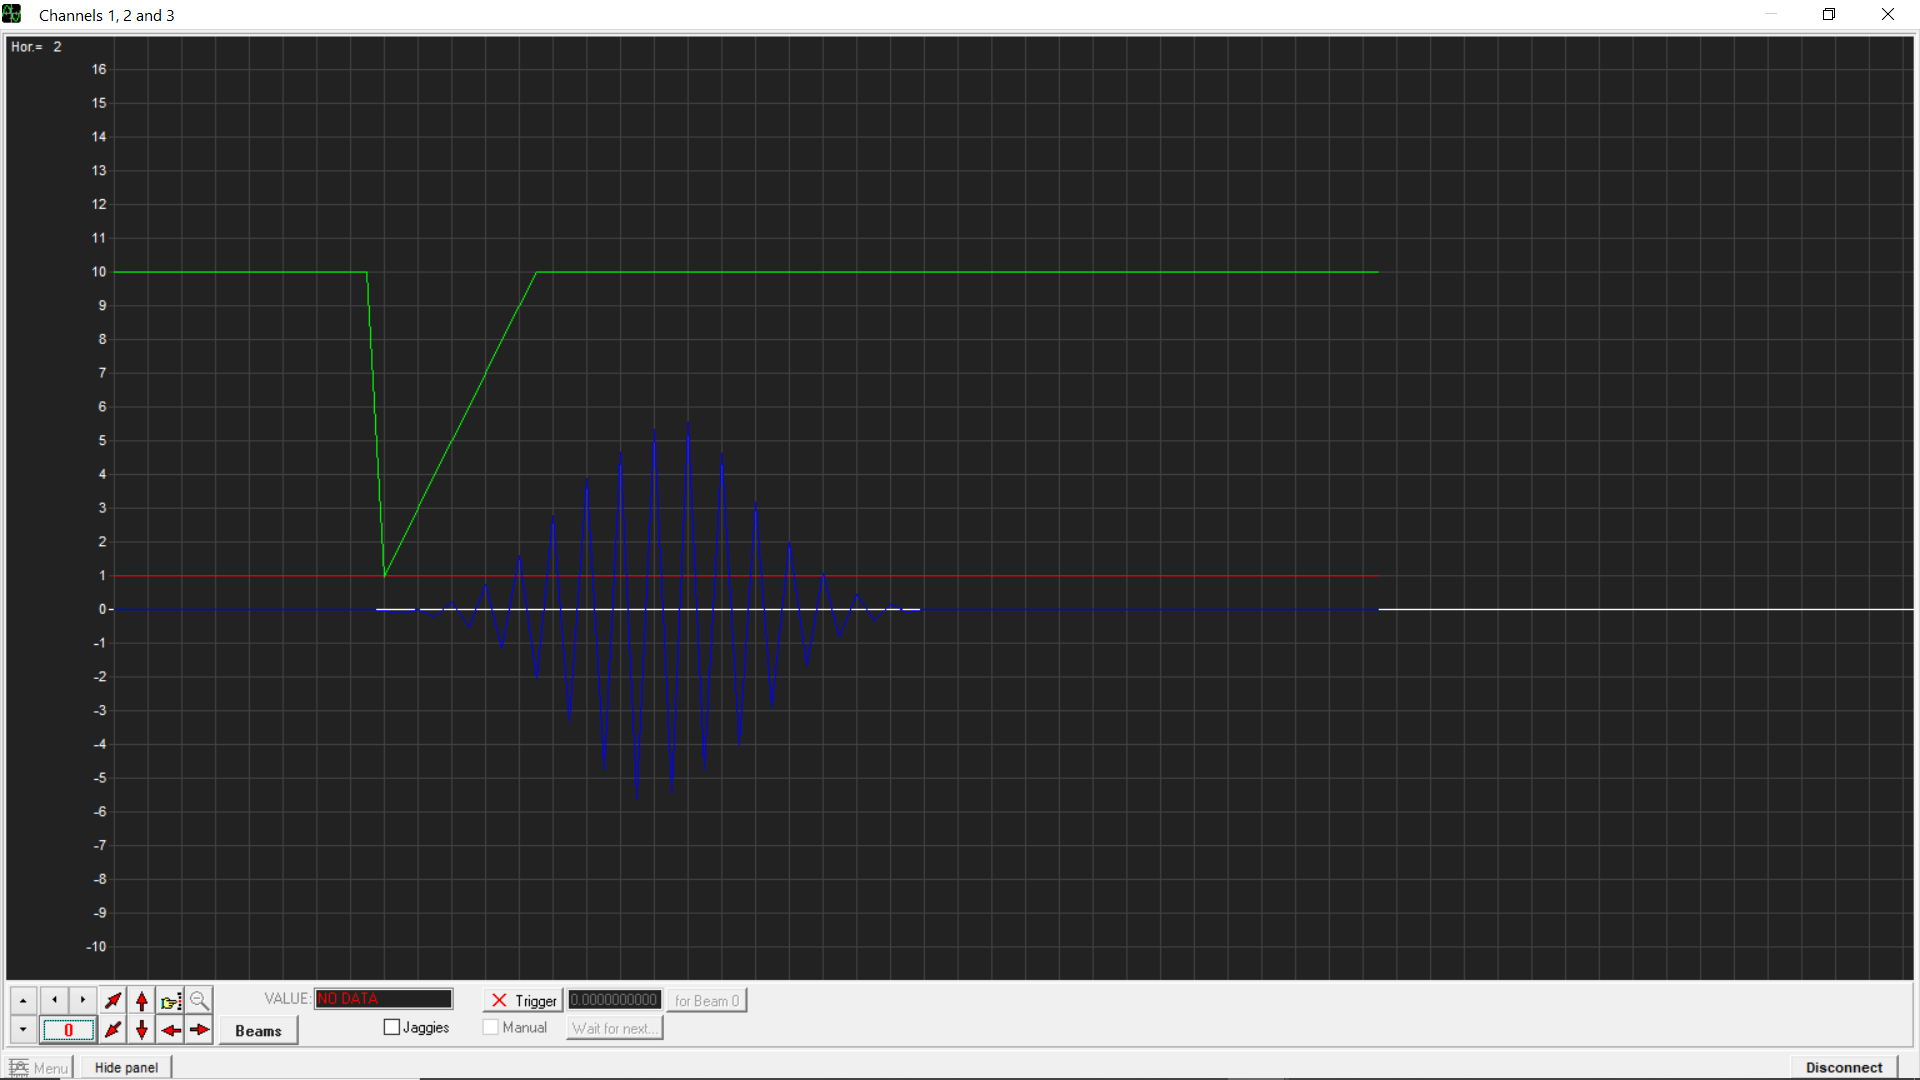
EDIT: I attached the filter step response plot:
Please post the code you used to implement the tfilter approach.
The sketch is attached in my prev post between the 2 pictures "ALS-PT19_test_sketch.ino". BTW this was the first time I used SerialScope and I noticed the y-axis values sometimes rescale to different values although the data remains the same. After I 'rezeroed' SerialScope the filtered output was reaching ~5k @ s.s. and ~ 100k during waving. Also the step response plot is from when I set the gain to 1.
I was interested in why the tfilter approach seemed to be fail so spectacularly. It works about as I expect, for the coefficients posted in #16.
Test code:
/*

  FIR filter designed with
  http://t-filter.appspot.com

  sampling frequency: 50 Hz

  0 Hz - 2 Hz
  gain = 0
  desired attenuation = -40 dB
  actual attenuation = -39.99747410361548 dB

  4 Hz - 8 Hz
  gain = 1
  desired ripple = 5 dB
  actual ripple = 4.177219343095732 dB

  10 Hz - 20 Hz
  gain = 0
  desired attenuation = -40 dB
  actual attenuation = -39.99747410361548 dB

*/

#define SAMPLEFILTER_TAP_NUM 32

typedef struct {
  double history[SAMPLEFILTER_TAP_NUM];
  unsigned int last_index;
} SampleFilter;

SampleFilter data;

//void SampleFilter_init(SampleFilter* f);
//void SampleFilter_put(SampleFilter* f, double input);
//double SampleFilter_get(SampleFilter* f);

// CLUE
#include <Adafruit_TinyUSB.h> // for Serial

void setup() {
  Serial.begin(115200);
  while (!Serial); //wait for connection
  SampleFilter_init(&data);

  float dt = 0.02; //50 Hz sample frequency
  float f = 1.0; //frequency in Hz
  float t, amp;
  Serial.print("Input frequency ");
  Serial.println(f);
  for (int i = 0; i < 4 * SAMPLEFILTER_TAP_NUM; i++) {
    t = dt * i;
    amp = 100.0 * sin(2.0 * M_PI * f * t);
    SampleFilter_put(&data, amp);
    if (i > SAMPLEFILTER_TAP_NUM) {
      Serial.print("t = ");
      Serial.print(t);
      Serial.print(", In = ");
      Serial.print(amp);
      Serial.print(", Out = ");
      Serial.println(SampleFilter_get(&data));
    }
  }
}

void loop() {
}

static double filter_taps[SAMPLEFILTER_TAP_NUM] = {
  -0.03279707747559653,
  0.0564197803772894,
  -0.10578342205356728,
  0.20285493607739602,
  -0.2876916909488668,
  0.42136877711926246,
  -0.5390065156446532,
  0.7255507258873886,
  -0.7541870635732753,
  0.9006053536065983,
  -0.9790790995202291,
  0.7383339815444103,
  -0.9337661385743616,
  0.5523324183427147,
  -0.3013876828851143,
  0.34123417195489286,
  0.34123417195489286,
  -0.3013876828851143,
  0.5523324183427147,
  -0.9337661385743616,
  0.7383339815444103,
  -0.9790790995202291,
  0.9006053536065983,
  -0.7541870635732753,
  0.7255507258873886,
  -0.5390065156446532,
  0.42136877711926246,
  -0.2876916909488668,
  0.20285493607739602,
  -0.10578342205356728,
  0.0564197803772894,
  -0.03279707747559653
};

void SampleFilter_init(SampleFilter* f) {
  int i;
  for (i = 0; i < SAMPLEFILTER_TAP_NUM; ++i)
    f->history[i] = 0;
  f->last_index = 0;
}

void SampleFilter_put(SampleFilter* f, double input) {
  f->history[(f->last_index++) & 31] = input;
}

double SampleFilter_get(SampleFilter* f) {
  double acc = 0;
  int index = f->last_index, i;
  for (i = 0; i < SAMPLEFILTER_TAP_NUM; ++i) {
    acc += f->history[(index--) & 31] * filter_taps[i];
  };
  return acc;
}
Maybe activate on noise level instead. Waving usually includes hellos once the candy hits. Errr, this is for Halloween?
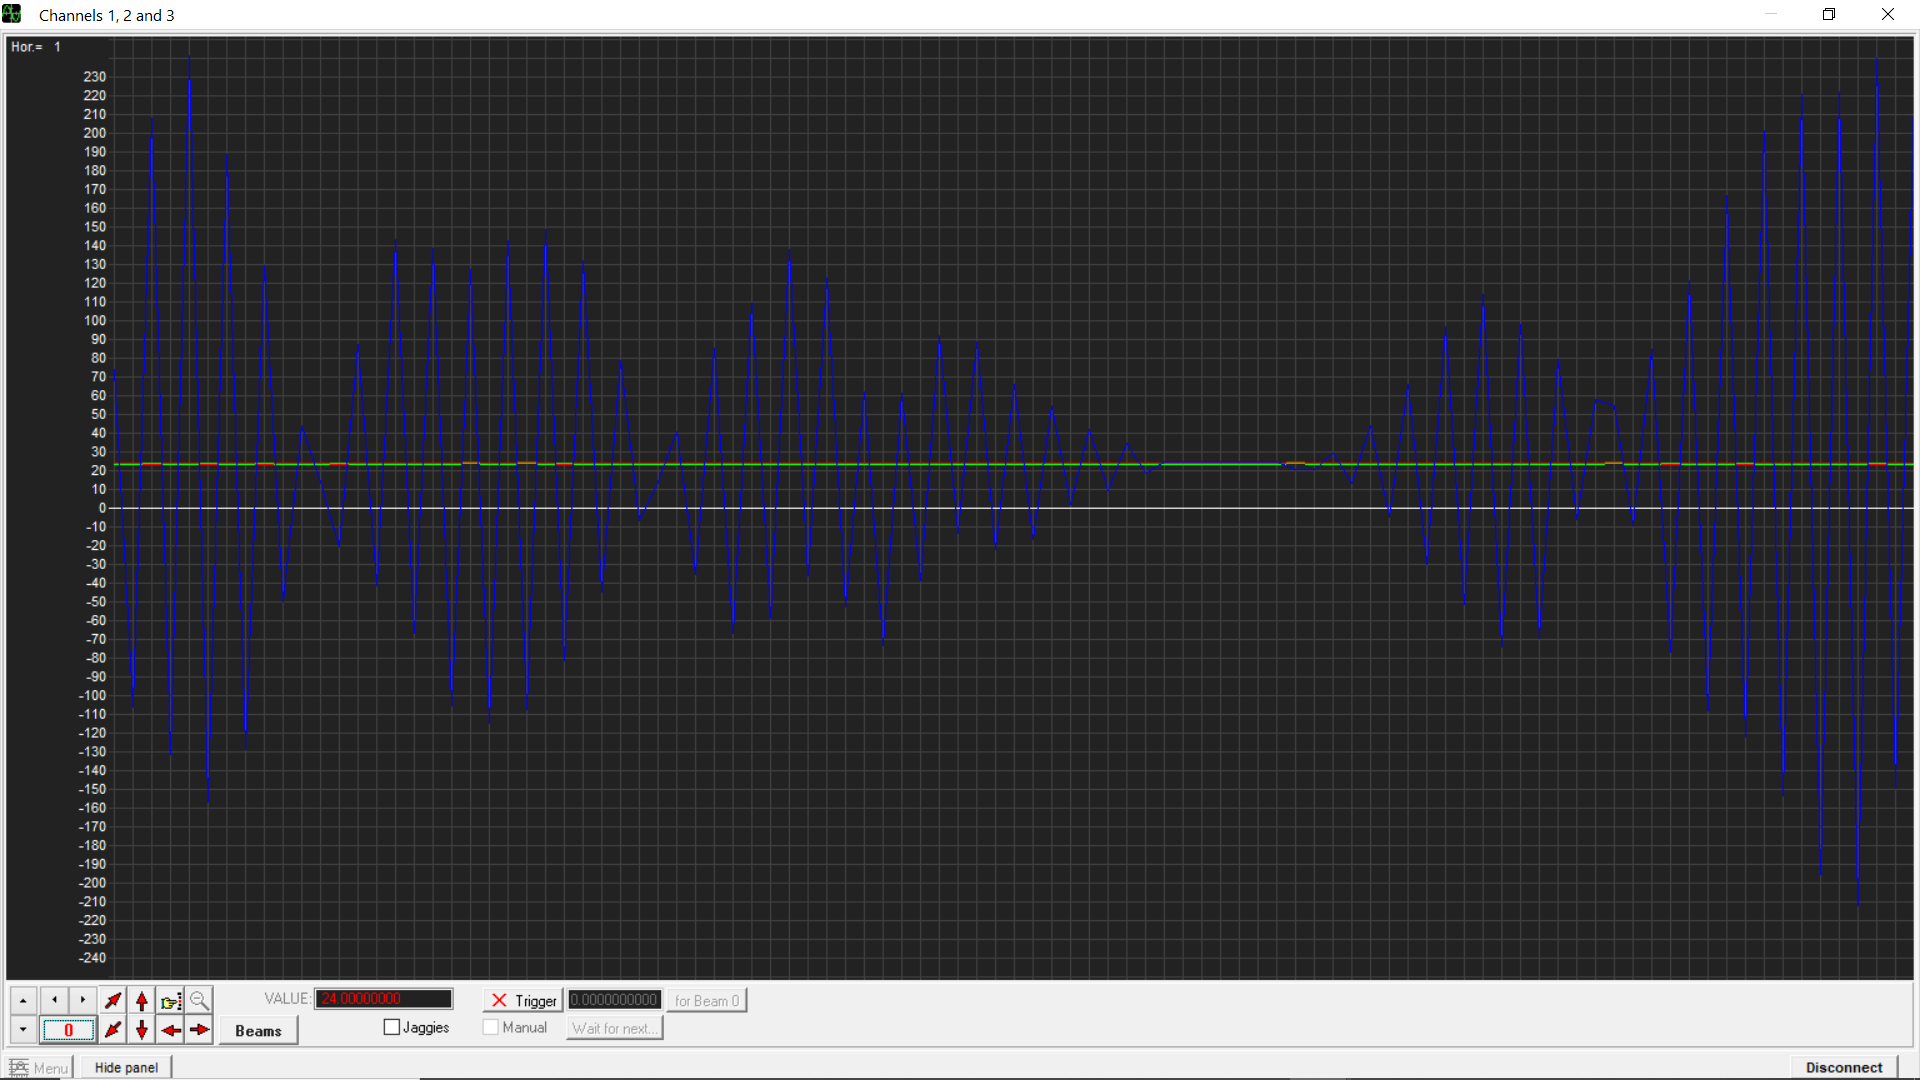
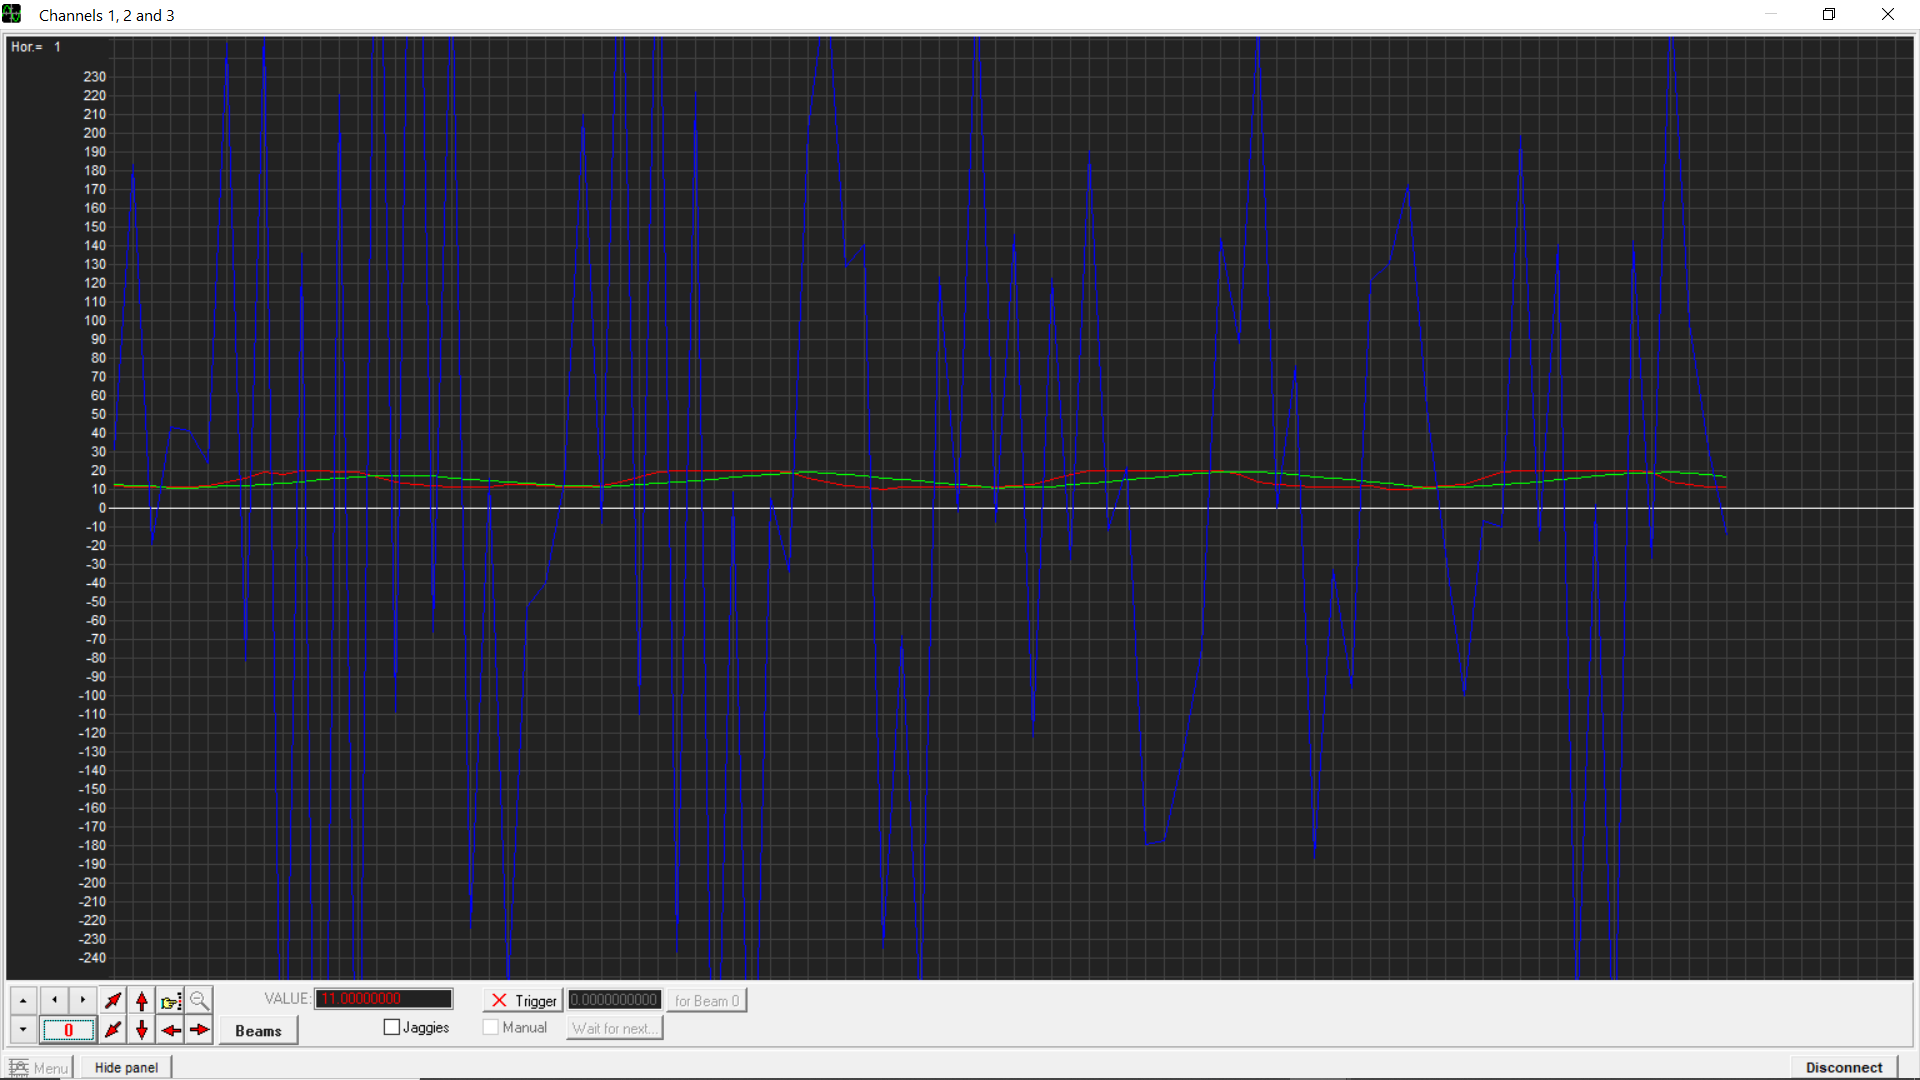
I copied your values into the sketch but I have a similar result, here are ss and waving plots, green is the moving average which seems to work well. How are you running the code? Could you send a pic of your result?
I was wondering if the behavior could be due to the nature of the filter which shows amplification of frequencies above 20Hz?
Sorry, I really have no idea what you are doing. You haven't posted enough information.
You MUST NOT allow signal components with frequencies higher than (sample frequency)/2 in the input data, or the output will be hopelessly aliased. Look up "Sample Theorem" and "Nyquist limit" to see why. When working with real data, you may need an analog low pass filter before the input becomes digitized.
I'm not sure what you meant about not knowing what I'm doing. I'm running the attached sketch with the filter coefficients you provided. The sketch samples the Mega2560 ADC at 50Hz and then provides the samples to 2 filters defined in the sketch, one 10-point moving average that seems to work and the FIR bandpass filter we are working on. For some reason the band pass filter doesn't appear to work right. Of course the signal has some noise in it, all signals do, in service there's going to be a lot of variation and noise, that's why I wanted the filter to filter everything out except the 2-6Hz frequency range. There are little tiny variations in the signal do you think these would be expected to cause the instability I see? You said the result is about what you expected, what input did you use? I attached some of my sensor data. I'll try to use the moving average output as the FIR input.
LoggedData steady.txt (1.2 KB)
LoggedData waving.txt (2.5 KB)
BTW I found this awesome free real-time serial signal fft app that is very practical easy to use user friendly and has many features: Serial Analyzer App. Highly recommend for Arduino users!
UPDATE:
I have tested 6 sensors to examine their output: TS2561 digital lux, HC-SR04 ultrasonics, TS2591 digital lux, ALS-PT19 analog light, RCWL-0516 microwave radar, VL53L0X TOF. I tried to apply filtering by moving average and FIR bandpass filtering. Bandpass tests have resulted in unexpected results and I am investigating further. The digital light sensors are not sensitive enough in low light to allow a high enough sampling rate, about 10Hz is max. The analog light sensor has high sensitivity and can be sampled faster. 50Hz seems to work. The VL53L0X TOF sensor seems to be most promising at this point, with fast sampling available and less sensitive to ambient lighting conditions. I have seen other TOF sensors that have a narrower field of view I would like to try as the VL53L0X field of view is 25 deg. I haven't yet tested my Sharp GY IR sensor as I have experience with it and don't expect good results. I am taking a deep dive into DSP and band pass filtering at the moment. I thought I would just look at the amplitude of the filtered time data to determine detection. After looking at fft I think a better approach would be to do peak detection in the frequency domain. Any suggestions are welcome. Attached are 3 plots, the first 2 are the bandpass applied to sensor data which has moving average applied to it, steady, and waving. The 3rd plot is an fft of averaged then filtered data. The time series data is unwieldy but the fft is possibly useful.
jremington - I didn't realize you had included an entire sketch in this post. I had only copied the taps into my own sketch without seeing the rest. I am testing your sketch method now, thanks.
Here is a sweep showing the amplitude response of the bandpass filter code designed by tfilter (32 point rms amplitude versus f in Hz for sine wave input), with improved coefficients (below).
f = 1.00 rms = 1.23
f = 2.00 rms = 1.10
f = 3.00 rms = 18.23
f = 4.00 rms = 58.18
f = 5.00 rms = 82.08
f = 6.00 rms = 58.94
f = 7.00 rms = 17.84
f = 8.00 rms = 0.45
f = 9.00 rms = 0.75
f = 10.00 rms = 1.16
f = 11.00 rms = 0.41
f = 12.00 rms = 0.83
f = 13.00 rms = 0.88
f = 14.00 rms = 0.12
f = 15.00 rms = 0.87
f = 16.00 rms = 0.64
f = 17.00 rms = 0.29
f = 18.00 rms = 0.85
f = 19.00 rms = 0.40
f = 20.00 rms = 0.47
f = 21.00 rms = 0.79
f = 22.00 rms = 0.18
f = 23.00 rms = 0.60
f = 24.00 rms = 0.68
static double filter_taps[SAMPLEFILTER_TAP_NUM] = {
  -0.00914691934262156,
  -0.012586091325471038,
  -0.011584300855738344,
  0.00006681876607035666,
  0.02118775422102955,
  0.04367288738020828,
  0.05366322062315583,
  0.03963868075211665,
  -0.0003807412651144632,
  -0.05355109783638832,
  -0.09652353824570964,
  -0.10546836894090349,
  -0.06982062802361327,
  0.00048578807343966864,
  0.07719518730486838,
  0.12680620042072246,
  0.12680620042072246,
  0.07719518730486838,
  0.00048578807343966864,
  -0.06982062802361327,
  -0.10546836894090349,
  -0.09652353824570964,
  -0.05355109783638832,
  -0.0003807412651144632,
  0.03963868075211665,
  0.05366322062315583,
  0.04367288738020828,
  0.02118775422102955,
  0.00006681876607035666,
  -0.011584300855738344,
  -0.012586091325471038,
  -0.00914691934262156
};