Need assistance turning mathematical formula into Arduino code

Thanks for your time.

PLEASE NOTE; I am brainstorming here. I have commented twice in this post and both should be read to understand my post :slight_smile: Happy to pay for the right advice.

Here is what I would like to do.

I would like to isolate/identify data values from an input sensor, then serial print the data that meets the condition I have.

The data is from an accelerometer, and I want only the acceleration data from an impact that occurs between two objects.

My accelerometer is connected to one of the objects.

There are periods where the object may move and not make an impact which is 'noise'. I only want to view the impact data, when an impact occurs.

Here is my thoughts on how to do it (also see below for further explanation of unique data point that identifies an impact in acceleration figures.


If acceleration is greater than some THRESHOLD,

AND the current acceleration figure B is opposite in direction to the previous figure A and figure C, where the order of events/data points is A,B then C

THEN print all data from acceleration data (before and after) THE EVENT which is above THRESHOLD

Where the
THRESHOLD would be g force that represents the stationary state.

Please note;
Figure B is attached excel spreadsheet cell 43
Figure A at cell 42
Figure C at cell 44


I have attached data from a specific event in the serial print data feed (from an MPU6050 accelerometer output) that I would like to have a function/method to isolate and print each time it occurs.

I noticed at the moment of impact the acceleration changes direction, then reverts to the same direction at the next available data point. The attached excel spreadsheet graph demonstrates what I am saying nicely. See the graph and excel cell value 43. I had to screen shot excel data and graph as the forum does not accept excel spreadsheet attachments.

The green data is the acceleration, the yellow is the moment of impact, and the red is the deceleration. Note the sign of the values simply indicated the direction of the g force.

What would be some suggested methods to isolate and serial print the data from the impact event, which only triggers printing results to the serial monitor when the events occurs? I am only interested in capturing the impact event.

My thought was to create a trigger/condition for serial print based on the below.


First is that possible to do in Arduino sketch? If not, what would be the alternatives?

Any suggestions would be greatly be appreciated and suggestions on how such a function could be written.

Best regards,

PS below is a copy of the acceleration data around impact.
-0.01
-0.04
-0.07
-0.07
-0.12
-0.16
-0.17
-0.24
-0.27
-0.29
-0.3
-0.31
-0.33
-0.35
-0.39
-0.4
-0.44
-0.51
-0.54
-0.54
-0.56
-0.58
-0.6
-0.66
-0.67
-0.72
-0.8
-0.89
-1.04
-1.27
-1.48
-1.73
-2
-2
-2
-2
-2
-2
-2
-1.66
-0.97
1.97
-1.89
1.2
2
2
2
2
2
2
2
1.8
1.63
1.3
0.82
0.39
0.06

Acceleration Bar Chart.pdf (207 KB)

Graph.pdf (338 KB)
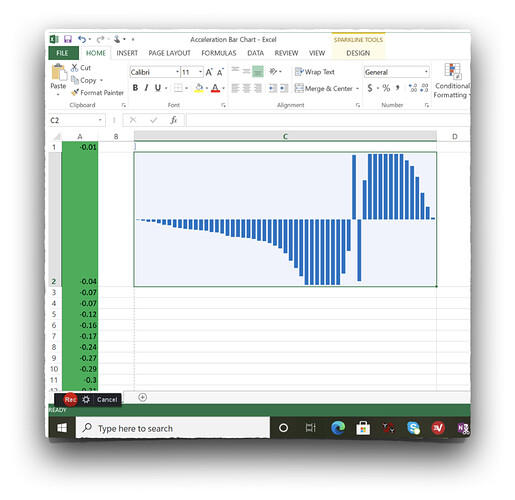
Your graph

if the change of sign is relevant, just track the change of sign

Thanks for responding.

The Change of sign is one indicator. However, the change of sign would also occur even if another object is not struck as the object accelerates, then decelerates and comes to rest. However, it will not always strike another object.

My thought on that is that the acceleration of the object does change sign when impacting another object, but the magnitude of the acceleration is also greater. Perhaps a moving average of accelation figures could be used in addition to the change in sign.

Or this may work.

If you look at the graph, the condition could be

If Sign changes,
AND
the value of acceleration at n is greater than average of absolute value of (n+1 and n-2 figure).

Actual figures taken from sensor data at impact were
n-2 -0.97
n-1 1.97
n (impact) -1.89
n+1 1.2

I say n+1 and n-2 as they look roughly the same size and are smaller in magnitude than value (figure) at n(impact).

If you deliver the math we can deliver the code.

There might be a limit in calculating-speed. F.e. an Arduino with a g-sensor connected by i2c-bus would perfom very poor as an anti-blockade-system in a car.

So if you can tell what will be the shortest impacts and the timeframe inside that
the change of g-forces occur a estimation if an Arduno is fast enough can be made.

The c++-language can do mathematics including power exponential ec. Though a complex formula with multiple use of mathemathical functions needs more time to execute than a simple comparison of value a greater than value b.

So for a deeper analysis can you provide multiple impact-events ss graphs and numbers that show the range how far the impacts deviate from each other?

Hi Stefan,

Thanks. Im sending you a PM message now.

just keep a rolling buffer of the last 5 (10 whatever) mesures and run your pattern detection algorithm on this buffer.

coding

If Sign changes,
AND
the value of acceleration at n is greater than average of absolute value of (n+1 and n-2 figure).

if not super difficult

Thanks JML and Stefan.

Ill keep the conversation in the post going forward. I only joined a few hours ago. I now understand the purpose and guidelines, in that I should post here so we can all share the benefits.

I conceptually understand how to solve this problem however I have no coding experience. My main questions was basically is it possible to process the data within arduino, rather than having to do it externally in Python etc. I now know the answer is yes, which is good news.

As Stefan noted, if the math can be clearly delivered then the code can be delivered and executed in Arduino.

I will provide more data sets tomorrow, and provide the mathematical method I am looking to implement.

Another question I have is that for a processor like MPU6050, what is the shortest interval as a fraction of seconds, that I can obtain each data result? Ie can it be obtained that I get one data point for every microsecond? The best article I found on this was
The MPU6050 Explained | Programming Robots. Is it saying I can get 16,384 acceleration measurements units per second?

Thanks again for your input

uh wow! a datapoint each microsecond. That's very ambitious. If it really has to be that fast a faster micrcotroller or even a bigger device is requiered. Things become much easier if you can share information about the whole project.

Depending of what you want to do maybe a high-speed digital storage-oscilloscope with a pretty large storage memory could do the job. even the detecting of the impact.

best regards Stefan

Cheap accelerometers like the MPU-6050 are limited to around 1000 data points per second, maximum, and the Arduino is not much faster.

You will need specialized and expensive equipment to measure 1 acceleration per microsecond.

Thanks people,

So what is more realistic in terms of acceleration data points?

***I REALISED AN ERROR HERE...I meant to say 1 millisecond as in (1/1000) not one microsecond. Apologies.

I mean it does not have to be every millisecond, but I was curious as it seemed to me at 10 microseconds that occasionally the MPU did not pick up the change in direction of acceleration on the moment of impact. Overall though, the data I gain gave a nice data curve, more than enough to see the general acceleration curve.

Would that maximum of 1000 be at 2g? That is how I interpreted the blog post The MPU6050 Explained | Programming Robots

Hi,

I have output data from an MPU6050. I would like to turn a mathematical function, or possibly some variants on the same idea, into code for arduino so I can 'process' and filter the output data.

I have an object, which accelerates from zero velocity the decelerates back to zero velocity, and also has an impact with another object.

The problem is that I only want to serial print the data from acceleration when the impact occurs, and filter out all other data.

The idea is to have a mathematical function that says 'hey Arduino, serial print data that meets the following CONDITION'.

The CONDITION would be that Arduino only 'prints' to serial print the last acceleration curve which was the largest, within the last 30 seconds (or any other useful parameter) such as within last 1000 data points from the sensor etc.

Another way could be that the functions recognises the momentary change in direction of the acceleration curve at impact.
***Please see attached curve and excel cell 43 in yellow.

The only issue with this method is that I noted sometimes the momentary change of direction of acceleration does not show up in results. This could be because the readings from the MPU6050 dont happen quick enough. I have been told that MPU6050 can get around 1000 data points per second so I'm sure that issue could be resolved. If so, being able to recognise the moment of impact, by momentary change of direction of acceleration (compare to the normal acceleration curve without impact) would be the best way to identify the correct acceleration curve as the impact data is what I am seeking to filter for.

Let me know if this is something you can assist with.

Attached are some sample data and graph.

Thanks,

Acceleration Bar Chart.pdf (207 KB)

Graph.pdf (338 KB)

"Assist" translates to "need some fool to write code for free", is it?

In the Datasheet they mention that it allows a sample rate of 8kHz for the gyrometer but the accelerometer allows only 1kHz.

I don't think the ±2g, ±4g, ±8g and ±16g choice has any impact on this, that just affects the precision of your measure as you get 16-bit from the ADCs.

To reach the 1kHz mark you will need to burst read the FIFO data buffer and if using I2C (at 400kHz) you'll need compact efficient code to process what you read before handling the next sample

I am happy to pay for the work. I used a tone and grammar appropriate to this thread.

It is assumed I will be paying for the assistance as I have posted in the thread called Gigs.

By definition, a gig means the person doing the gig gets paid.

Thank you for your enlightened, yet misguided, contribution to my post.

My bad, sorry. But there's no function in your posting. Are your values compensated for rotation?

Topics on the same subject moved and merged

Cross-posting is against the rules of the forum. The reason is that duplicate posts can waste the time of the people trying to help. Someone might spend 15 minutes (or more) writing a detailed answer on this topic, without knowing that someone else already did the same in the other topic.

Repeated cross-posting will result in a timeout from the forum.

In the future, please take some time to pick the forum board that best suits the topic of your question and then only post once to that forum board. This is basic forum etiquette, as explained in the sticky "How to use this forum - please read." post you will find at the top of every forum board. It contains a lot of other useful information. Please read it.

Thanks in advance for your cooperation.

Thanks for getting in touch.

I also posted in the gigs section of the website with more concise information on what I am trying to achieve.
https://forum.arduino.cc/index.php?topic=707635.msg4755268#msg4755268

Also see below for more information


I have attached results I have obtained.

The sketches I used are
MPU6050 Triple Axis Gyroscope & Accelerometer. Pitch & Roll & Yaw Gyroscope Example.

GIT: GitHub - jarzebski/Arduino-MPU6050: MPU6050 Triple Axis Gyroscope & Accelerometer Arduino Library
Web: http://www.jarzebski.pl
(c) 2014 by Korneliusz Jarzebski

and
Acceleration Sketch

The results for pitch, roll and yaw are in degrees. The sketch allows for the degree of sensitivity of the change in degrees to be increased also within the sketch.

The accelerations is units of gravity.

Please see these video links of the results I obtained. I think things will be much clearer then.

Video record of data obtained at impact of cue ball.

Explanation of data video.
https://screencast-o-matic.com/content/video/cY6eeUK2yv

I WANT TO OBTAIN DATA FROM A SNOOKER CUE WHICH IMPACTS A CUE BALL -

The main goal is that every time a shot is completed, the latest data is display for that shot, which would be the pitch, roll and yaw, and also the acceleration.

Let me know your thoughts

Where's the sensor - in the cue or in the ball?

I also posted in the gigs section of the website with more concise information on what I am trying to achieve.

So I saw. The two topics have been merged

zwieblum:
Where's the sensor - in the cue or in the ball?

I would say it’s In the cue since there is acceleration (pushing the cue) then the shock on the ball gives the kick back and then the cue goes on its course. The ball would be standing stil, before the shock and just accelerate.