I want to use the Serial Plotter to demonstrate the charging and discharging of a capacitor for educational purposes, helping students visualize the input voltage and the voltage across the capacitor. My goal is to clearly show the exponential increase and decrease during charging and discharging. Additionally, I want to label the x-axis as time (in milliseconds) and the y-axis as output voltage (in volts), allowing students to observe the real-time data and pick out the time constant directly from the plotter graph. However, I'm having trouble achieving this and could use some assistance.
Code:
int ChargePin = 8;
int inputPinC = A0;

unsigned long previousMeasureMillis = 0;
unsigned long previousMillis = 0;
const long chargeInterval = 10000;        // 10s charge/discharge time
const long measureInterval = 100;         // 10 samples per second

int chargeState = LOW;
float Vcapacitor = 0.0;

void setup() {
  pinMode(ChargePin, OUTPUT);
  Serial.begin(115200);
}

void loop() {
  unsigned long currentMillis = millis();

  if (currentMillis - previousMillis >= chargeInterval) {
    previousMillis += chargeInterval;

    if (chargeState == LOW) {
      chargeState = HIGH;
    } else {
      chargeState = LOW;
    }
    digitalWrite(ChargePin, chargeState);
  }

  if (currentMillis - previousMeasureMillis >= measureInterval) {
    previousMeasureMillis += measureInterval;

    // Read analog value and convert to voltage
    Vcapacitor = (analogRead(inputPinC) / 1023.0) * 5.0;  // Convert raw value to voltage

    // Print the capacitor voltage in volts
    Serial.print("DATA, ");
    Serial.print(Vcapacitor, 2);  // Print capacitor voltage with 2 decimal places
    Serial.println("V");
  }
}
Those traces and output and baud rate don't look like they come from that code. What is the issue?
If you write this as:
    Serial.print(Vcapacitor, 2);  // Print capacitor voltage with 2 decimal places
    Serial.println();
It will identify the trace properly and not plot the two spurious traces.
I prefer:
Vcapacitor = 5.0* (analogRead(inputPinC) +0.5)/ 1024; // Convert raw value to voltage
per everything at:
Since the serial plotter labels the X axis in infrequent sample numbers and smoothly interpolates between them, it really isn't the tool to plot directly in milliseconds/seconds, etc.. You might try sampling more often. Maybe every millisecond or so to reduce the impact of the interpolation.
You could print both time and voltage, and then do the analysis in a system that can plot x versus y.
The traditional method is to do it with an oscilloscope:
This is not supported. However, you can label the variable. This is done by this format of output:
<label>:<value>\n
So if you wanted to label the variable "DATA", you would use this code:
    Serial.print("DATA:");
    Serial.println(Vcapacitor, 2);  // Print capacitor voltage with 2 decimal places
As @DaveX already explained, you must not do this. Please keep in mind that the data the sketch is printing is formatted for machine consumption, not for a human to read. So if you add extra stuff like this then you are only going to confuse the plotter and get bad results. Use the exact format I described above.
Yeah, the Arduino IDE 2.x plotter only shows 50 points at a time. The Arduino IDE 1.x plotter shows 500 at a time.
OK, the issue is that the signal on the serial plotter doesn't give exponential increase or decrease taking full time which is five times of tau to reach the final value of input voltage it seems like there is a mistake in part of the plotter or code although the x and y I meant to label it as a voltage across the capacitor and time in milliseconds. so I need help in that!
I think if you look at your data outside of the serial plotter and in the serial monitor, your 100ms sample time is only giving a couple samples to draw through. With only one intermediate point, that's not enough to detect an exponential decay. With a burst of 50 points on the screen, you should be able to sample 25x faster at 4ms and maybe see something useful.
Consider:
int ChargePin = 8;
int inputPinC = A0;

unsigned long previousMeasureMillis = 0;
unsigned long previousMillis = 0;
const long chargeInterval = 10000;        // 10s charge/discharge time
const long measureInterval = 4;   // 50 samples *4ms = 200ms interval

int chargeState = LOW;
float Vcapacitor = 0.0;

int burst = 50; // one serial plotter screen width

void setup() {
  pinMode(ChargePin, OUTPUT);
  Serial.begin(115200);
}

void loop() {
  unsigned long currentMillis = millis();

  if (currentMillis - previousMillis >= chargeInterval) {
    previousMillis += chargeInterval;
    burst = 50; // reset
    if (chargeState == LOW) {
      chargeState = HIGH;
    } else {
      chargeState = LOW;
    }
    digitalWrite(ChargePin, chargeState);
  }

  if (currentMillis - previousMeasureMillis >= measureInterval) {
    previousMeasureMillis += measureInterval;
    if (burst) { // print samples
      // Read analog value and convert to voltage
      Vcapacitor = (analogRead(inputPinC) / 1023.0) * 5.0;  // Convert raw value to voltage

      // Print the capacitor voltage in volts
      Serial.print("DATA: ");
      Serial.print(Vcapacitor, 3);  // Print capacitor voltage with 2 decimal places
      Serial.println();
      --burst;
    }
  }
}
that was helpful, appreciated but id you could tell me how make this charging signal increase in such a way that exponentially no vertical line as trace in the plotter here
I already explained to you that this is not possible. Please make sure to read what we write here carefully.
If you really need these labels, then you will need to use different software. If you don't need real time plotting, you can capture the raw serial data to a file and then import it to a spreadsheet program (e.g., LibreOffice Calc, Excel), then use its chart generation capability. Various serial terminal applications support writing the serial data to a file. I can recommend the free open source PuTTY terminal for that purpose:
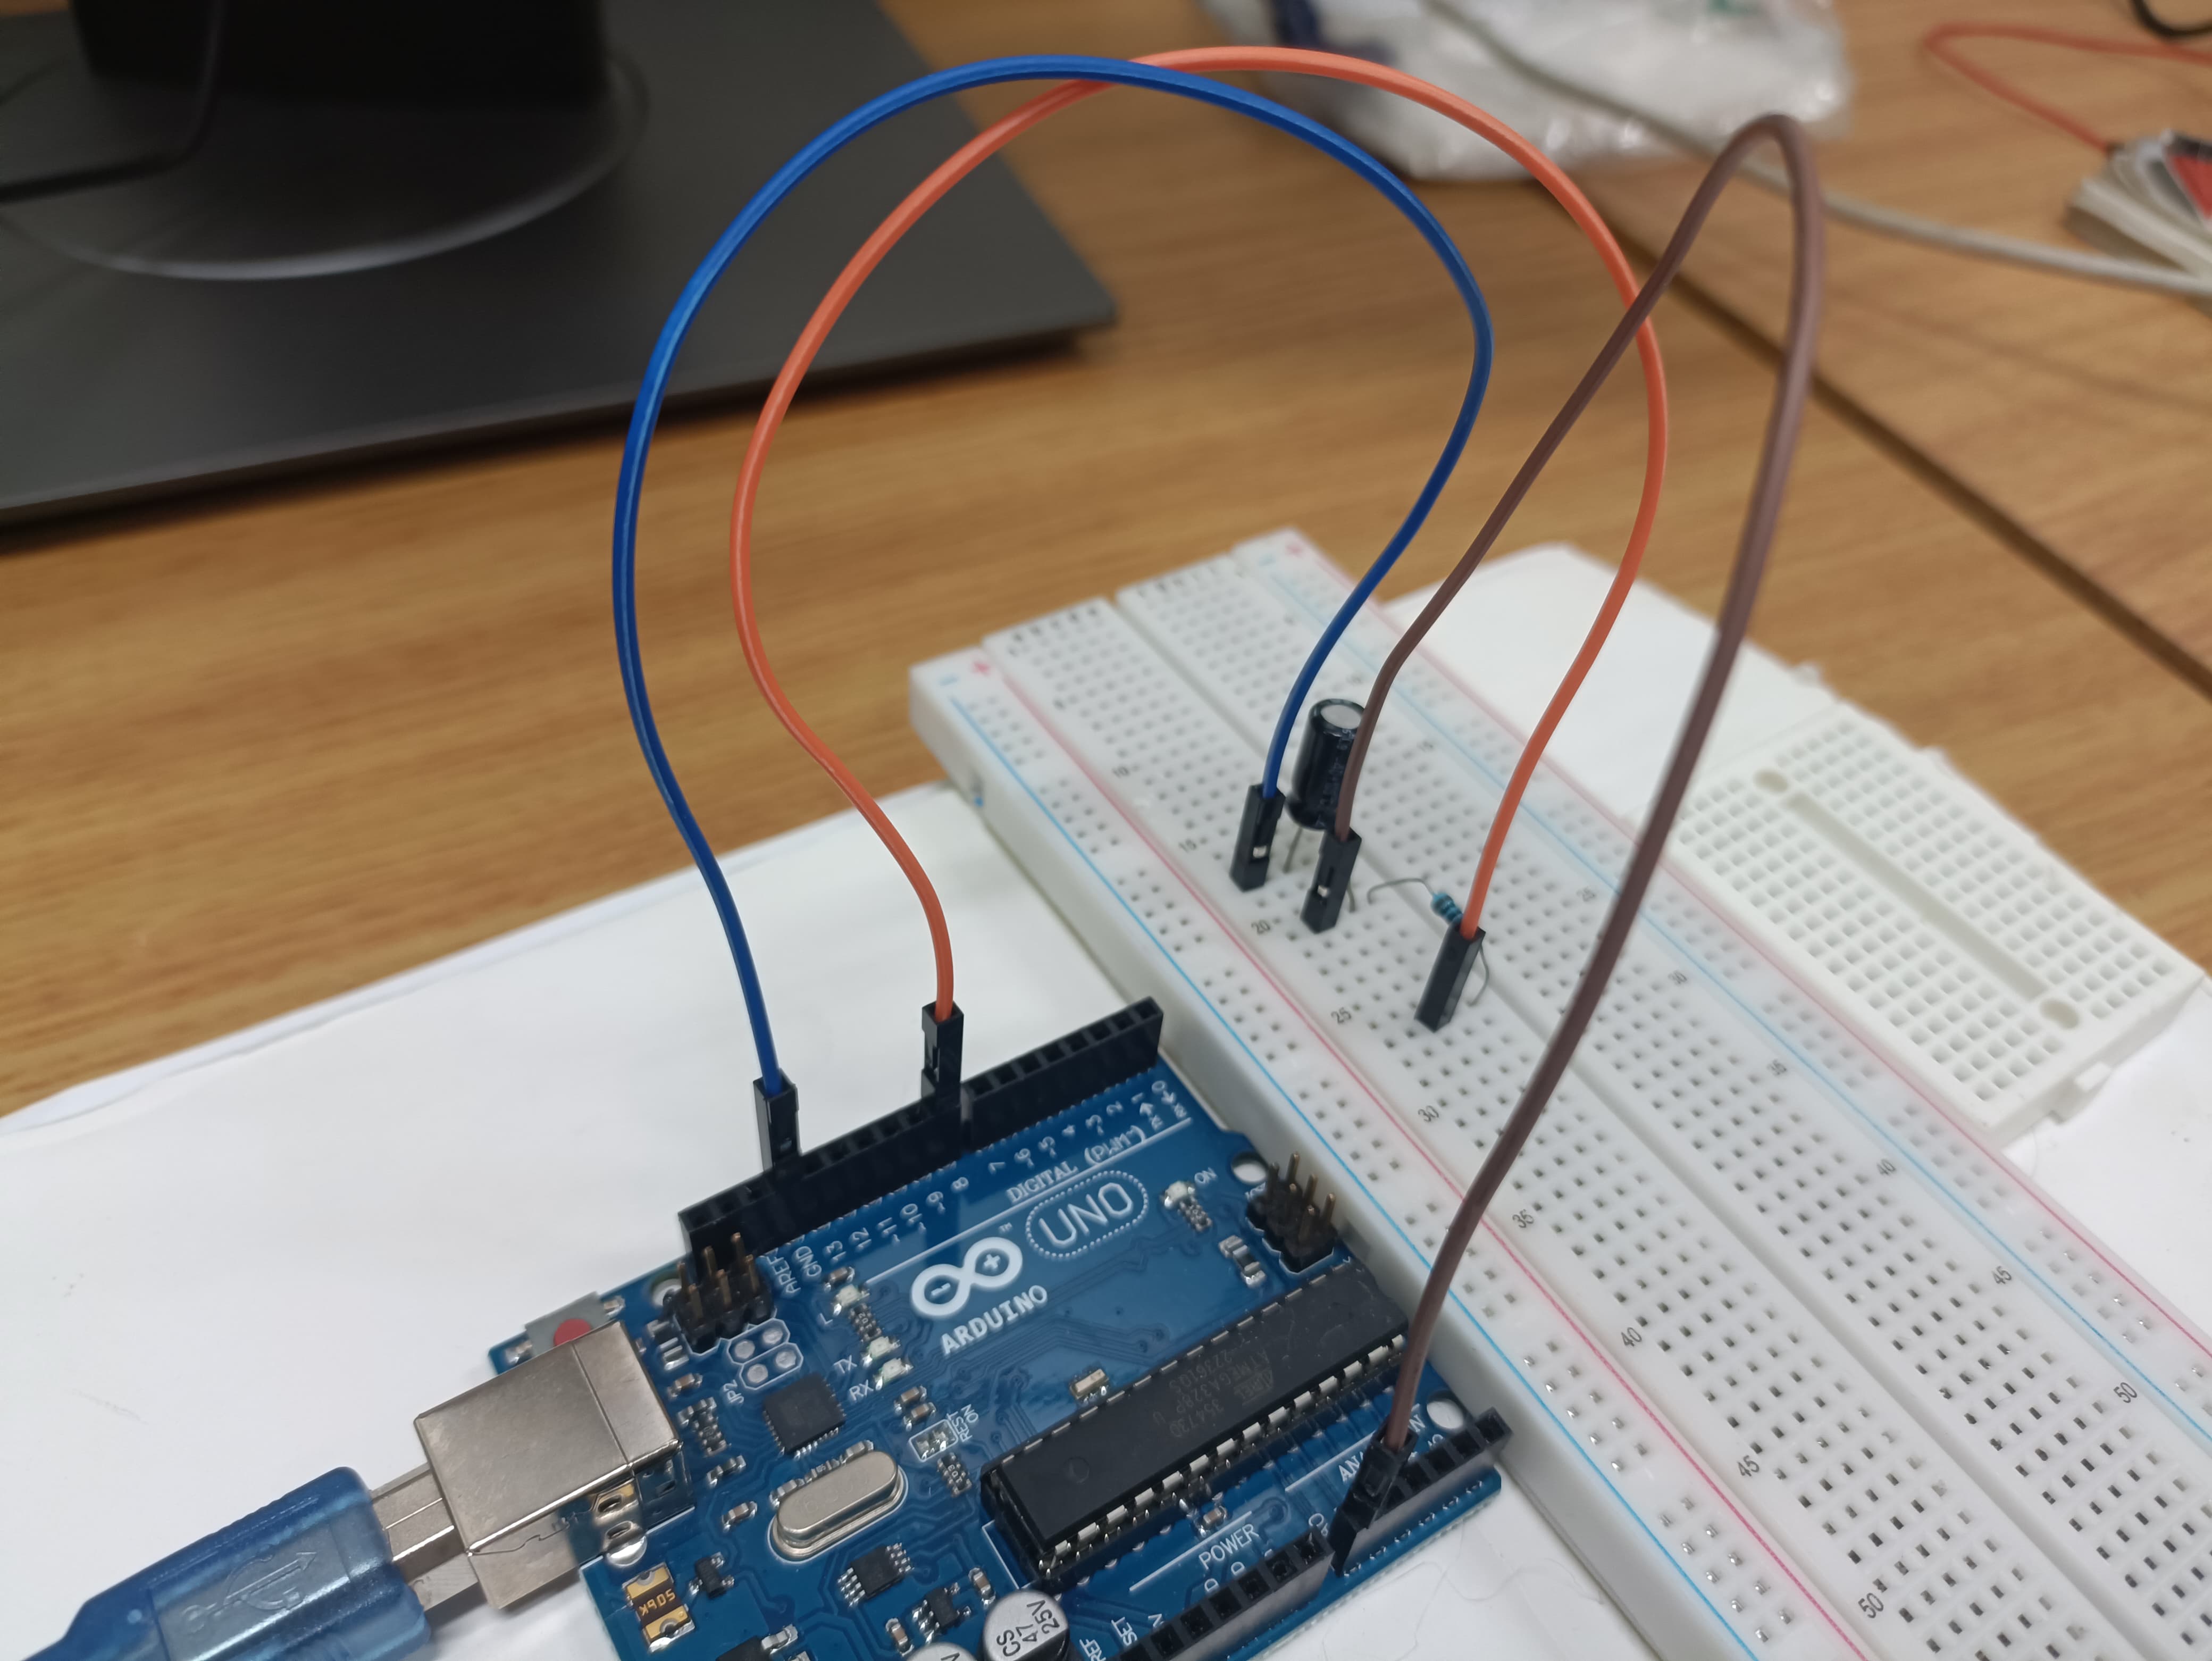
The circuit looks reasonable. 100uF and 10Kohm? Is the electrolytic capacitor connected with the correct polarity?
Your graphs look like they reach full voltage in 1 or 2 100ms points:
... which doesn't at all match a:
Do you have a DMM/meter so you can check the actual values?
Or watch the voltage rise on the meter? You could put a meter across the cap, take the arduino out of the circuit and pulse the resisor manually with a jumper to +5/gnd and see what the meter measures. If the circuit is healthy, you should be able to calcualate the time of a pulse from the voltage of the DMM.
I have tested the code that you showed in post 1, with no alterations.
I used a 100µF capacitor and a 10kΩ resistor, soldered on to strips of header pins.
The results were as expected, you can see the capacitor charge and discharge:
You were right, DaveX! I used an ohmmeter to check the continuity of each wire, and I found one that wasn’t conducting properly. I replaced it, and now I’m getting the results I was looking for. Haha! See it. Charge and Discharge capacitor.zip (669.7 KB)