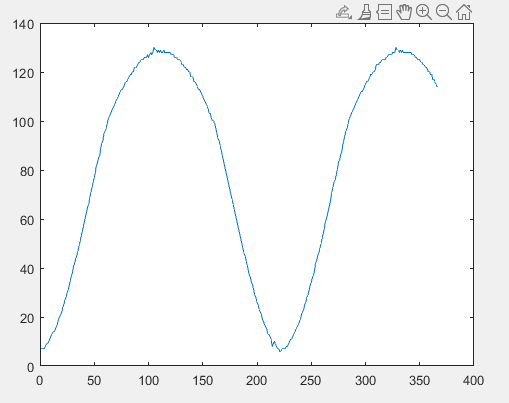
I'm in the process of reading a sine signal. I connected the signal to A0. If I plot the values and then insert them into Matlab, the sine curve doesn't look particularly nice. Is there a better way than delay?
According to your picture, it is a 50Hz signal. That means 20ms per cycle. But you only read once every 200ms. For a reasonably good representation, you should read at least 10 times/cycle, i.e. at least every 2ms. This also requires a high baud rate, and you should use millis() for the timing.
Really? It looks pretty nice to me, really. Especially given the remarks made about sampling speed; if this was sampled at 200ms intervals and it's the same signal you showed on the scope trace, it's actually pure magic that you got this outcome.
Yeah, there are a few blips near the high and the low ends of the curve that might require looking into, and there's of course a pretty hefty distortion going on, hence the question from @Grumpy_Mike what the circuitry looks like.
a 50Hz serial has a period of 20mSec so sampling every 200mSec would sample across multiple sine waves and give someting that looks like a valid result
often seen examples where data was displayed which missed the important high frequency components
the 50Hz signal should be sampled at least every 10mSec
Good point. Although for this to be true there would have to be a very nice and convenient shift in the delay so that the entire sine wave would be neatly sampled.
No it won't. Have you ever looked at a signal that is sampled at the Nyquist rate. It looks absolutely nothing like the original signal.
This is a commonly misunderstood thing. At that rate you can just extract the information that a signal is at that frequency but it will look nothing like it. You need at least 20 samples per cycle to make it look like the signal would on an oscilloscope.
Notice that with delay, the time used to take a sample becomes part of the sampling interval. So you will be sampling longer than 200ms. Using millis properly will fix that.
200mSec is 10 times the 20mSec period of a 50Hz signal so sampling over multiple sine wave with a small time delay could give the appreaance of a valid signal.
I ask again, this again. Is this book learning or have you actually done the experiment and seen the result?
I have done this many times, the first time back in 1974. It can not give you anything like a visually recognisable waveform.
Do I have to drag out my equipment and post pictures before you will get it into your head?