hi all,
I am trying to read an automotive oxygen sensor. It is the narrow band sensor so that means it gives a frequency range between 0 to 1 volt. I am a bit new to programming. I need help with reading the frequency. At a certain time the signal is oscillating between to voltage differences. But it is very quick. I want to know how can i read the top and bottom of that oxcillating voltage.
thank you.
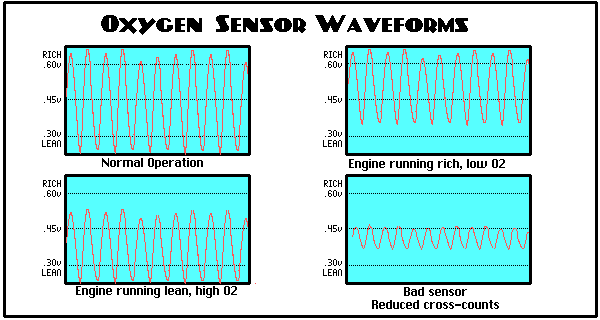
you can see the wave form here. I want to read the upper and lower limit of the wave form. Anyone help me with the code. I am a noob so completely blank here.
It is the narrow band sensor so that means it gives a frequency range between 0 to 1 volt.
Frequency range is something between 1kHz and 3kHz for example..
Could you give us link to the sensor's datasheet?
i am trying to get a data sheet for this narrow band but its automotive part so a little harder to get the datasheet with much info. Got this one link
http://www.timloto.org/download/pdf_lesbrieven/deltapress/motormanagement/taskO2sensor.pdf
and ill try to find some more.
I'd run sensor's signal to analog comparator than measure duty cycle. It looks like lean - reach may be identified as less or more than 50%, and normal operation just in the middle.
Malfunction sensor ;d provide unstable output, and easy to spot in software.
Arduino's set of commands doesn't include internal analog comparator feature, so your option is dig a data sheet and write in assembly, or use external , like LM311 IC.
Look here how to measure freq./ period:
http://interface.khm.de/index.php/lab/experiments/
Magician:
I'd run sensor's signal to analog comparator than measure duty cycle. It looks like lean - reach may be identified as less or more than 50%, and normal operation just in the middle.
Malfunction sensor ;d provide unstable output, and easy to spot in software.
Arduino's set of commands doesn't include internal analog comparator feature, so your option is dig a data sheet and write in assembly, or use external , like LM311 IC.
Look here how to measure freq./ period:
http://interface.khm.de/index.php/lab/experiments/
But wouldnt that give me the frequency. I think i didnt understand it fully.
In my setup i want to read the top level and lower level of the voltage waves. like in the normal operation the voltage waves are rising to .65v and back to .25v. I want the arduino to read these two values. Cause i only require these two values to work with.
It sounds to me like you're asking for the voltage range; the peak and trough of the wave as indicated in this image rather than frequency, yes?
If so, you need the analogue pin of the Arduino (and we are about to get complicated). I'm not sure of the resolution of the Arduino, but I assume a full 5V will be indicated with 65535 (or is there an option to choose between 255 and 65535). If I am correct, then you are going to have the Arduino to check a value on the pin, echo it to terminal, and repeat (fast). You will then insert these values into something like Microsoft Excel and make a graph of them.
The highest number you get should be around 8519. The lowest should be about 3276. This is unless 5V becomes 255. Then these numbers, respectively, should be: about 33, and about 13. But if you want accuracy, you need an oscilloscope.
free-bee:
It sounds to me like you're asking for the voltage range; the peak and trough of the wave as indicated in this image rather than frequency, yes?
yes exactly. But i dont need the excel part.
i just want to know if its in rich range or lean range or normal. if i can get that information in a variable or something then i have a setup which will controll the the air flow and fuel. But i just need to know the range of the sensor reading i am stuck there.
kaashvicky:
It is the narrow band sensor so that means it gives a frequency range between 0 to 1 volt.
What is the frequency in that graph? Frequencies don't come in volts, they come in Herz.
As a starter look up arduino oscilloscope. You want the examples that look at analogue signals.
Mark
Sir please i am new to these things so i make mistakes. That wont end the world. This is my second post that you are pointing out things that other people understand but you dont. I came here to ask for help. Not to be tortured for everything i write. I already mentioned in my post that i am new to these things.
holmes4:
As a starter look up arduino oscilloscope. You want the examples that look at analogue signals.Mark
ok i will look into that.
kaashvicky:
[quote author=Nick Gammon link=topic=174051.msg1293031#msg1293031 date=1372229223]
kaashvicky:
It is the narrow band sensor so that means it gives a frequency range between 0 to 1 volt.What is the frequency in that graph? Frequencies don't come in volts, they come in Herz.
Sir please i am new to these things so i make mistakes. That wont end the world. This is my second post that you are pointing out things that other people understand but you dont. I came here to ask for help. Not to be tortured for everything i write. I already mentioned in my post that i am new to these things.
[/quote]
I was hoping for an answer to my question: "What is the frequency in that graph?"
Instead I get a rant.
I was hoping for an answer to my question: "What is the frequency in that graph?"
I thought they teach frequency in basic physic courses, but looks like OP was absent.
In a doc, reply #3, 1 Hz, probably it may go up to (6000 RPM / 60) X (4 cylinders?) = 400 Hz, anyway arduino could measure duty cycle with 16-bit resolution or so
I can't read that data sheet because it's written in foreign, but I'm not at all confident that you've understood the output signal correctly. The narrow band O2 sensors I've used have all output an analog signal which indicates the instantaneous pp O2. The output is usually highly non-linear and changes from 'min' to 'max' over a relatively narrow band of O2 readings (hence the name) so these sensors are typically just used to indicate 'rich' and 'lean', with the closed loop control system designed to keep cycling between these two conditions. The reading will normally fluctuate through the engine cycle since the exhaust gas composition isn't uniform, and the average reading will also cycle at about 1Hz or so as the closed loop control system alters the fueling. Without seeing the data sheet I can't be sure that your sensor works like this, but it seems consistent with those graphs you posted. I guess it's possible to have a sensor that outputs the pp O2 signal in the form of a variable frequency or duty cycle but it seems to me a pretty weird thing to do and I haven't encountered any sensor that do that. Before you get too far into worrying about sampling techniques and so on, make sure you fully understand the signal you're trying to capture.
I thought they teach frequency in basic physic courses, but looks like OP was absent.
I'm pretty sure that the answer to the question is that the frequency is NOT what matters. It is the high and low values that are important, not the time between them.
uote
I thought they teach frequency in basic physic courses, but looks like OP was absent.
I'm pretty sure that the answer to the question is that the frequency is NOT what matters. It is the high and low values that are important, not the time between them.
Frequency is important for decision on a method of solving problem. If it's quite low, almost all project can be completed on single AtMega328 IC, using internal comparator. Resolution 16 bit 'd be sufficiently enough to get 0.01%, even with all non-linear sin(X) -> duty cycle transformation. But if let say F = 100 MHz, than only hardware, double peak detectors solution possible.
I dont even have to go upto 6000 rpm . At max the engine will run upto 2000 rpm in my application. And i am using arduino mega 2560 r3.
here is something different i found.
http://www.scirocco.org/tech/misc/afgauge/af.html
http://www.dohcfiero.com/DIYairfuel.htm
they have made a simple led monitor with led driver LM3914N. the signal in causes the led go from 1 to ten accordingly to the leannes or richness of the fuel. Now i thought if maybe the function of this IC can be written in code and recieve signal from the o2 sensor. or maybe if there is a chip which can convert this non linear value to linear value.
I'm pretty sure that the answer to the question is that the frequency is NOT what matters. It is the high and low values that are important, not the time between them.
PaulS is completely -- CORRECT. Two int's used to record the highest and lowest readings over a second or two allows you to sort out the four possible situations.
In this case the higher the frequency the better.
@ a couple of the other posters, the UNO and mega use a ADC with a max of 10 bits see the datasheet which is of course available.
Mark