Sorry If I am mistaken, but is this correct looking from the breadboard's perspective? I simplified this. Touching resistor shows 0.89.

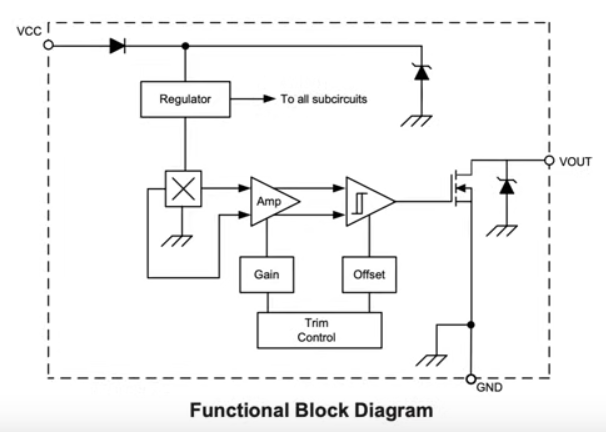
Yes, the breadboard circuit is correct for testing the water flow (hall effect) sensor output. It appears to be open drain as in 4:08 in this video.
Water flow sensor hall effect circuit:
You can use it safely connected as per post #55.
1 Like
Hi there, sorry if I'm asking a dumb question, but having read through this thread now two times, I'm still stuck with a similar problem:
- I'm using a YF-B5 water flow sensor as well, and have by now unsuccessfully spent lots of time trying to get a linear pulse-flowrate-relationship. I can calibrate the sensor for a certain flow rate, but as soon as the flow rate changes, the readings are off (and I assumed that the turbine inside the sensor still does its job reliably).
- Variables I've tried out to change: Sensor voltage 3V vs. 5V, Tasmota CounterDebounce 0 ms - 50 ms setting, Using ESP32 vs. ESP8266.
- Voltage: 3V vs. 5V did not have any effect
- ESP: Switching ESPs also did not have any effect
-
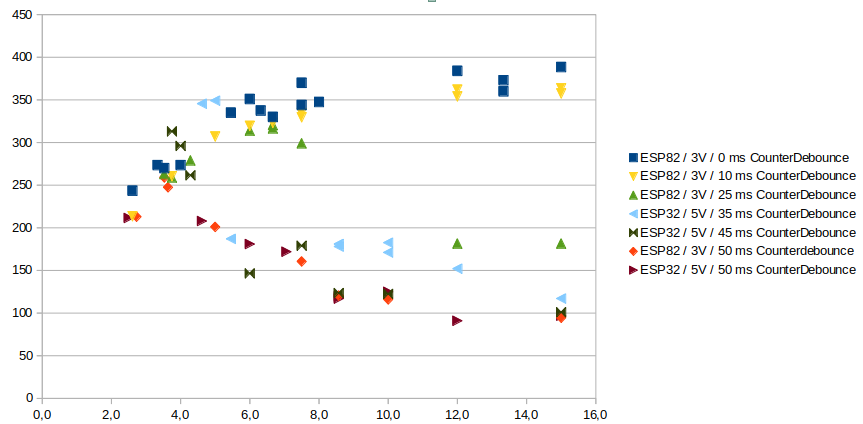
CounterDebounce in Tasmota seemed to have an effect, but it's still far from a linear relationship (see below): When water runs slow, the readings are far off.
Now I did see some breadboard schematics in this thread above, but am still puzzled which one represents a suitable hardware debounce for the YF-B5 sensor which I should try?
Any suggestions?
Hi, @xeltar, please see post #55 for my current (correct) diagram. Also, as per dlloyd's recommendation in the post #58, I've checked out this library and opened this ticket. I hope it would be possible to calibrate this sensor using that library. What calibration factors do you use?
Thanks. Will try out later this week and report back my experiences. However, if I understand you correctly, even with this hardware fix you‘re still not receiving stable results, correct?
So far none. As you can see in my graph above, I‘ve so far only collected a relatively large amount of measurement data on „# of pulses over flow rate and some other variables“. The fact that they didn’t turn out to be horizontal lines made me start looking for other options to calibrate (i.e. found your post in this Forum and signed up ![]()
I am receiving stable pulses (meaning, I am not receiving any pulses when the water is not running, which previously was a problem), but the incorrect data calculated from those pulses is not correct.
So I did another measurement with the HW debouncer from post #55.
The results leave me somewhat puzzled (the measurement with the HW debounce are the light green, also see the legend). I'd also say it only makes sense to compare "0 ms Software-Debounce" with "0 ms Software-Debounce & Hardware Debounce".

What's odd:
- Comparing those two, I would've expected that the one with the Harware-Debounce ends up having fewer impulses...
- ... but my measurement shows more impulses, unless I did something very stupid?!?
- Still there's a substantial slope in the curve, meaning that the # of impulses is not independent of the flow rate, which is bad for accurate measurements of different flow rates.
- One could say that the one at "0 ms Software Debounce without the Hardware-Debounce" is equally good than the one with the Hardware Debounce: Even though the number of impulses is on a different absolute level, the slope of the curve is very similar and thus, if one would implement a "normalization logic over flow rate" in software, it could be an equally good basis.
So my verdict, even with the Hardware Debounce, is for now still the same:
- While the sensor can be used to measure liquids of only one flow rate...
- ... it remains complicated to be used for different flow rates at acceptable accuracy, because the curve needs to be simulated in a software to normalize the # of impulses.
- What I still don't understand: is the variation in impulses because the turbine just turns slower at lower flow rates (cheap / poor design), or because the SW / HW-Debounce are not yet optimized for the turbine characteristics?
- What I also don' understand: The ratings of the flow meter on Amazon are really good. Does everyone else know something that's not known here? Or is it just used to measure the same flow rates (in which case it is good)?
Thoughts on this are very welcome!
I suspect these things are all much the same, and this entire thread has been a pointless wild goose chase.
Using the Freetronics/Jaycar code, which is essentially the same as all the other's stuff, I find that the rate is all over the place and impossible to read, but the daily quantity is very accurate - within 1% of the commercial heat meter that I use for comparison. If you confine your tests to long-term quantity, you may find the sensor is fine. My typical readings are intermittent flows of about 5l/min for about 300l over 24 hours.
The Arduino progamme only logs data when rate exceeds 1l/min, which seems to work OK.
I think my problem was probably down to reading the data too frequently - 1Hz. The Engelmann meter only delivers readings every ten seconds, and I guess the take the time to average more frequent readings.
I assume you have 5v available for the turbine, I have heard that 3.3v is not enough.
So after more than a month of trial-and-error and a now a more-or-less stable and reliable installation, a quick update on our sensor:
- The sensor appears to not need a hardware or software debouncing to be accurate, since the signals are fairly clean. A colleague of mine managed to capture the signal with his oscilloscope, and the signals at various speeds appear to be clean enough.
- The sensor, however, produces a pulse/flow-rate relationship far from being linear but overall stable (as seen in my post above; this part is still the same than around one month ago). That said, to achieve reliable measurement results at different flow rates, one needs to have some sort interval-differentiation for the pulse/flow-rate-calculation.
- What worked quite well for this task: Have a tasmota script to run on the ESP that counts the number of pulses per second every second, thus determining the flow rate cluster in which “this second” was in, and then calculating the water flown through in this second. In my case, since I’m using the sensor to measure flow rates ranging from “fully open” down to “drip irrigation”, I had to define five clusters (ranging from 5 pulses/sec up to 150 pulses/sec) to have correct results at various flow rates.
- For those who’re interested, the script my colleague wrote can be found here: GitHub - KonstantinPfeiffer/TasmotaWaterFlow
- From what I can see, I would strongly recommend to do a calibration on the specific sensor, since I did see some (not large, but still) variation between two sensors (especially for the larger sensor which I bought for my pump).
- With all this considered, the sensor works pretty well and I consider it worth the money, if one likes tinkering around a bit.

Did you ever find documentation giving the error rate based on various flow volumes? I suspect you won't find them, either. I could not.
Nope, not at all, despite specifically looking for it (which is probably not the best sign, to not find hints for this anywhere on the net).
The manufacturers rationale is probably that, given the design of the sensor, they know that the pulse/flow-rate-ratio is not linear, and mentioning this upfront in a spec sheet would hurt sales. Hence not mentioning this at all in the spec sheet (except for useless tolerance-statements).
This topic was automatically closed 180 days after the last reply. New replies are no longer allowed.