FFT, how would you accelerate it?

I've been working on a VFO project on the arduino IDE working with the clasic bluepill STM32, and im very proud of my badly coded project, im not the best with code one function i would like to implement is a spectrograph and with the FFT library this is kinda posible but how would you speed up this code? not because i want an sdr but just because im reaching the limits of my knowledge.

#include "SPI.h"
#include "Adafruit_ILI9341.h"
#include "arduinoFFT.h"

// Definición de pines
#define TFT_CS    PA4
#define TFT_DC    PB1
#define TFT_RST   PB0
#define CHANNEL   PA3

// Definiciones FFT
#define TFT_WIDTH  640
#define TFT_HEIGHT 80
#define GRAPH_TOP_MARGIN    4
#define GRAPH_BOTTOM_MARGIN 4

Adafruit_ILI9341 tft(TFT_CS, TFT_DC, TFT_RST);
arduinoFFT FFT;
unsigned int sampling_period_us;
const uint16_t samples = 512;

double vReal[samples];
double vImag[samples];

void setup() {
  // Inicialización del TFT y elementos visuales
  tft.begin();
  tft.setRotation(1);
  tft.fillScreen(ILI9341_BLACK);
  tft.setTextColor(ILI9341_WHITE);
  tft.setTextSize(1);

  // Definición de la frecuencia de muestreo para la FFT
  sampling_period_us = round(1000000 * (1.0 / 100000));  // Ajusta según sea necesario

  // Otras inicializaciones...
}

void loop() {
  // Llamada a la función para realizar la FFT y dibujar la gráfica
  performFFTAndDrawGraph(0, 150);
}

void performFFTAndDrawGraph(int xOffset, int yOffset) {
  unsigned long microseconds = micros();

  // Toma de muestras del ADC
  for (int i = 0; i < samples; i++) {
    vReal[i] = analogRead(CHANNEL);
    vImag[i] = 0;
    while (micros() - microseconds < sampling_period_us) {
    }
    microseconds += sampling_period_us;
  }

  // Configuración y cálculos de la FFT
  FFT = arduinoFFT(vReal, vImag, samples, 100000);
  FFT.Windowing(FFT_WIN_TYP_RECTANGLE, FFT_FORWARD);
  FFT.Compute(FFT_FORWARD);
  FFT.ComplexToMagnitude();

  // Eliminación de las 3 primeras magnitudes
  //vReal[0] = 0;
  //vReal[1] = 0;

  // Configuración de los márgenes y dimensiones del gráfico
  int graphWidth = TFT_WIDTH;
  int graphHeight = TFT_HEIGHT - GRAPH_TOP_MARGIN - GRAPH_BOTTOM_MARGIN;
  int startX = xOffset;
  int startY = GRAPH_TOP_MARGIN + graphHeight + yOffset;

  // Calcula el ancho de cada barra en el gráfico
  float barWidth = 1;

  // Encuentra el valor máximo en los datos de la FFT y su índice
  int maxMagnitude = 0.0;
  int maxIndex = 0;
  for (int i = 0; i < samples / 2; i++) {
    if (vReal[i] > maxMagnitude) {
      maxMagnitude = vReal[i];
      maxIndex = i;
    }
  }
  if (maxMagnitude < 5000) {
    maxMagnitude = 5000;
  }

  // Calcula la frecuencia correspondiente al índice del pico máximo
  float frequency = (maxIndex * 1.0) / (sampling_period_us * 1e-6 * samples);


  // Dibujo de las barras de la gráfica
  for (int i = 0; i < samples / 2; i++) {
    int barHeight = static_cast<int>((vReal[i] / maxMagnitude) * graphHeight);
    int x = startX + static_cast<int>(i * barWidth);
    int y1 = startY - barHeight;

    tft.drawFastVLine(x, yOffset + 2, 73, ILI9341_BLACK);
    tft.drawFastVLine(x, y1, barHeight, ILI9341_GREEN);
  }

  // Muestra el pico máximo y su frecuencia
  tft.setCursor(10, 10);
  tft.print("Pico Maximo: ");
  tft.fillRect(80, 10, 50, 10, ILI9341_BLACK);
  tft.print(maxMagnitude);
  tft.setCursor(120, 10);
  tft.print(" en Frecuencia: ");
  tft.fillRect(200, 10, 70, 10, ILI9341_BLACK);
  tft.print(frequency);
  tft.print(" Hz");
}

this is a simple "spectrum analyzer" that i have managed to make run to 100000ks/s, so i can recognize a 50khz signal, but if want to deal with the other signals coming from a radio like audio level batery voltage, current consuption swr measurements i think i need some faster code or another MCU, does anyone have experience doing something like this?
github

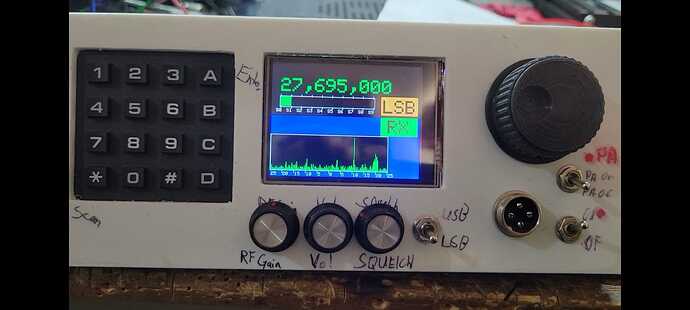
Here's a picture of the radio
Hi @gcrcien welcome to the forum.

This code is nothing more than a simple delay. It is not needed at all because an analogRead does not return anything until it is finished the sample, so this extra delay is just slowing things down.

First of all thank you,
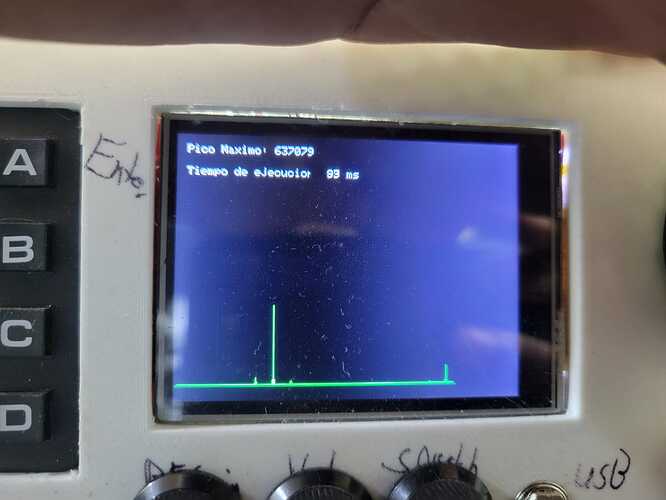
I managed to speed it up to 93ms average between screen refresh for the fft alone, this was due to some changes also made to the ADC prescaler of the Bluepill


This is a samplerate of around 288khz which lets me see a max of 144khz which to be honest is way more than i need, but its cool to have some room to spare, i think i can make it faster since ive seen some reports of 5Ms/s on other pages, but i think the real issue is the fft calculation itself.
i think if i can make it run over 15fps it would be great but the more the better, i will keep experimenting and reporting back.
In the meantime here is the code for the above mentioned results

#include "SPI.h"
#include "Adafruit_ILI9341.h"
#include "arduinoFFT.h"

// Definición de pines
#define TFT_CS    PA4
#define TFT_DC    PB1
#define TFT_RST   PB0
#define CHANNEL   PA3

// Definiciones FFT
#define TFT_WIDTH  320
#define TFT_HEIGHT 80
#define GRAPH_TOP_MARGIN    4
#define GRAPH_BOTTOM_MARGIN 4

Adafruit_ILI9341 tft(TFT_CS, TFT_DC, TFT_RST);
arduinoFFT FFT;
unsigned int sampling_period_us;
const uint16_t samples = 512;

double vReal[samples];
double vImag[samples];

void setup() {
  //SPI.beginTransaction(SPISettings(40000000, MSBFIRST, SPI_MODE0));

  SPI.setClockDivider(2);
  adc_set_prescaler(ADC_PRE_PCLK2_DIV_2) ;
  //adc_set_sample_rate(ADC2, ADC_SMPR_7_5);
  adc_set_sample_rate(ADC2, ADC_SMPR_1_5);

  // Inicialización del TFT y elementos visuales
  tft.begin();
  tft.setRotation(1);
  tft.fillScreen(ILI9341_BLACK);
  tft.setTextColor(ILI9341_WHITE);
  tft.setTextSize(1);

  // Definición de la frecuencia de muestreo para la FFT
  //sampling_period_us = round(1000000 * (1.0 / 100000));  // Ajusta según sea necesario

  // Otras inicializaciones...
}

void loop() {
  // Llamada a la función para realizar la FFT y dibujar la gráfica
  unsigned long startTime = micros();

  // Llamada a la función para realizar la FFT y dibujar la gráfica
  performFFTAndDrawGraph(0, 150);

  unsigned long endTime = micros();
  unsigned long executionTime = endTime - startTime;

  // Muestra el tiempo de ejecución en la pantalla
  tft.setCursor(10, 30);
  tft.print("Tiempo de ejecucion: ");
  tft.fillRect(120, 30, 70, 10, ILI9341_BLACK);
  tft.print(executionTime/1000);
  tft.print(" ms");
}

void performFFTAndDrawGraph(int xOffset, int yOffset) {
  //  analogReadResolution(10);

  unsigned long microseconds = micros();

  // Toma de muestras del ADC
  for (int i = 0; i < samples; i++) {
    vReal[i] = analogRead(CHANNEL);
    vImag[i] = 0;

  }

  // Configuración y cálculos de la FFT
  FFT = arduinoFFT(vReal, vImag, samples, 288000);
  FFT.Windowing(FFT_WIN_TYP_RECTANGLE, FFT_FORWARD);
  FFT.Compute(FFT_FORWARD);
  FFT.ComplexToMagnitude();

  // Eliminación de las 3 primeras magnitudes
  vReal[0] = 0;
  vReal[1] = 0;

  // Configuración de los márgenes y dimensiones del gráfico
  int graphWidth = TFT_WIDTH;
  int graphHeight = TFT_HEIGHT - GRAPH_TOP_MARGIN - GRAPH_BOTTOM_MARGIN;
  int startX = xOffset;
  int startY = GRAPH_TOP_MARGIN + graphHeight + yOffset;

  // Calcula el ancho de cada barra en el gráfico
  float barWidth = 1;

  // Encuentra el valor máximo en los datos de la FFT y su índice
  int maxMagnitude = 0.0;
  int maxIndex = 0;
  for (int i = 0; i < samples / 2; i++) {
    if (vReal[i] > maxMagnitude) {
      maxMagnitude = vReal[i];
      maxIndex = i;
    }
  }
  if (maxMagnitude < 5000) {
    maxMagnitude = 5000;
  }

  // Calcula la frecuencia correspondiente al índice del pico máximo


  // Dibujo de las barras de la gráfica
  for (int i = 0; i < samples / 2; i++) {
    int barHeight = static_cast<int>((vReal[i] / maxMagnitude) * graphHeight);
    int x = startX + static_cast<int>(i * barWidth);
    int y1 = startY - barHeight;

    tft.drawFastVLine(x, yOffset + 2, 73, ILI9341_BLACK);
    tft.drawFastVLine(x, y1, barHeight, ILI9341_GREEN);
  }

  // Muestra el pico máximo y su frecuencia
  tft.setCursor(10, 10);
  tft.print("Pico Maximo: ");
  tft.fillRect(80, 10, 50, 10, ILI9341_BLACK);
  tft.print(maxMagnitude);

}

Glad you got it going.

Another way to speed things up is not to use the display to print every transition. A much simpler way to measure the speed is to put a pin high at the start of a section you want to measure and put it low when this is done. Then measure the period on an oscilloscope.

Using a digitalWrite on an Arduino Uno takes about 4uS, but you can do this in a couple of clock cycles with direct port manipulation techniques.

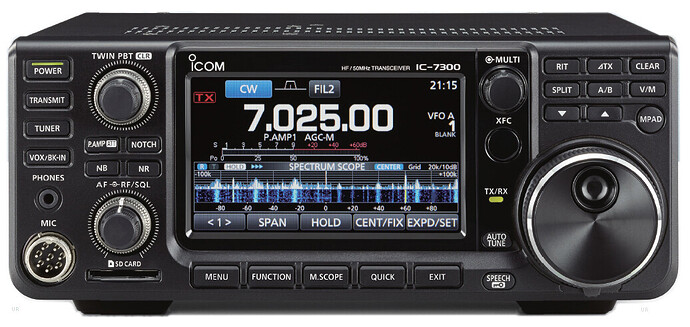
The thing is, i dont care about transitions, i really want to do some simple dsp and show it on the screen, this is just the start but ideally i ant this, or something similar.
My project now its just the vfo, however i have started to work on the rf side of things, i dont want a lot of bandwidth, just enough to see whats happening around me.
i need to start to work on the waterfall graph now too :smiley:

This topic was automatically closed 180 days after the last reply. New replies are no longer allowed.