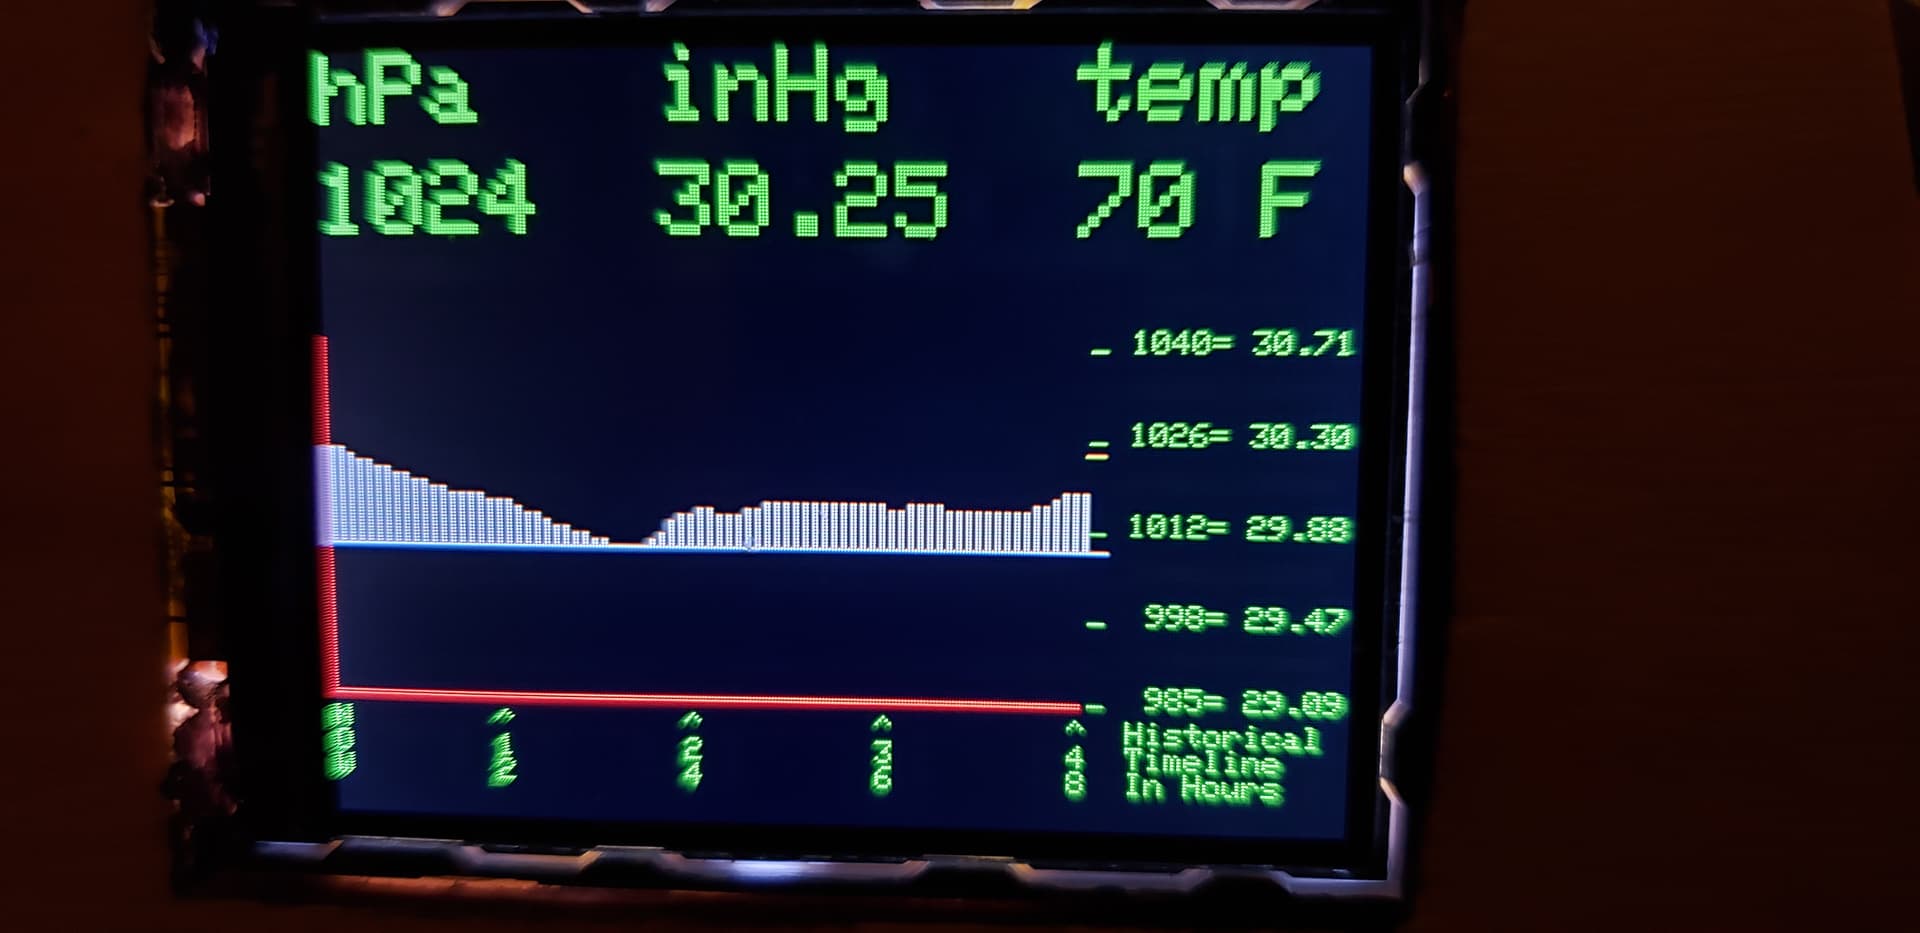
I like to look at daily barometric pressure, rolling over a 48-hour (arbitrary) window.
Behind-the-scene an array keeps the rolling values from the barometer, new readings are "pushed" in and the oldest reading falls out.
There is nothing magical about 48 hours, just need to keep arrays reasonable to the amount of SRAM.
You could just as easy write each "update" to an SD, but then there is that sneaker-net to PC to import and visualize.
Worker routines:
void StoreHistory ( void ) {                                      // Creates a boxed border using lines 0 & 1
  int  n;                                                         // avoid compiler complaints in for(;;) loop
  // array [0] is reserved for newest value                       // Therefore [80] = [79], [79] = [78],..., [1]==[0] after shift
  for (n = 80; n > 0; n--)                                        // shift history array to the right, oldest value [80] is lost
  {
    pHistory[n]      = pHistory[(n - 1)];                         // shift data right, oldest value lost, [1] becomes [0] the current value
  }
  pHistory[0]        = M;                                         // save current "adjusted" pressure hPa [0]
}


void displayCurrent( void ) {
  int temp1, temp2;                                               // working vars for type conversion

  lcd.setTextSize(3);                                             // Print hPa and inHg legends and readings in large font
  lcd.setCursor(0, 1);  lcd.print("hPa   inHg   temp");
  lcd.setCursor(0, 35); lcd.print( M );

  if ( M < 1000 ) {
    lcd.print("   ");
  } else {
    lcd.print("  ");
  }

  temp1              = inHg / 10;                                 // Integer component
  temp2              = ((inHg / 10) - (float) temp1 ) * 100;      // 2 decimal places

  lcd.print(temp1); lcd.print(".");
  lcd.print(temp2);

  lcd.setCursor(235, 35);
  lcd.print( temperature, 0 );

  if (Fahrenheit) {
    lcd.print(" F");
  } else {
    lcd.print(" C");
  }
}


void displayHistory( void ) {
  long     M;
  long     minimum   = 1040L;
  long     maximum   = 985L;

  uint8_t  h, z;
  uint16_t x, y;

  z = 0;                                                          // z will span 0 to 319, full screen landscape width in pixels

  for ( x = 1; x < 240; x++ )                                     // 80 elements @1 element per 18 minutes = 10 elements per 3 hours
  {
    if ( x % 3 == 0 ) {                                           // this provides for skipping every 3th position for bar spacing
      z++;
    } else if (pHistory[z] != 0) {                                // array is initially init to zero value, no need to plot this
      if (pHistory[z] < minimum) minimum = pHistory[z];           // capture the lowest  24 hour pressure reading
      if (pHistory[z] > maximum) maximum = pHistory[z];           // capture the highest 24 hour pressure reading
      h = (pHistory[z] - 985) * 2;                                // h is for height and x2 is for scaling factor
      y = 200 - h;                                                // Adafruit's GFX y coordinates plots upside down, flip reference
      lcd.drawFastVLine(x,  y,   h, ILI9341_WHITE);               // 2 bars are drawn per array element and 1 blank space for separation
    }
  }

  y = 200 - ((minimum - 985) * 2);

  for (x = y ; x < 200; x++) {                                    // Alternate display mode
    lcd.drawFastHLine(1, x, 245, ILI9341_BLACK);
  }

//    drawFastHLine(uin86_t x0, uin86_t y0, uint8_t length, uint16_t color);
  lcd.drawFastHLine(1, y, 245, ILI9341_WHITE);                    // draw baseline   24 hour lowest reading
  y = 200 - ((maximum - 985) * 2);
  lcd.drawFastHLine(239, y, 6, ILI9341_YELLOW);                   // draw marker tic 24 hour highest reading
}


void drawLegends( void )
{
  // Legends and axis for display
  lcd.setTextSize(1);
  // Atlanta: High = 30.79 on 1/6/1924	Low = 29.08 on 1/11/1918
  // 2X scaling: 1040 - 1026 = 14 x 2 = 28 pixels
  lcd.setCursor(240,  84); lcd.print("_ 1040= 30.71");            // setup Y legends
  lcd.setCursor(240, 112); lcd.print("_ 1026= 30.30");
  lcd.setCursor(240, 140); lcd.print("_ 1012= 29.88");
  lcd.setCursor(240, 168); lcd.print("_  998= 29.47");
  lcd.setCursor(240, 194); lcd.print("_  985= 29.09");
  // tiny fonts for timeline legend @53 char/line (6px/char)
  lcd.setCursor(0, 205); lcd.print("N        ^         ^         ^         ^  Historical ");
  lcd.setCursor(0, 213); lcd.print("O        1         2         3         4  Timeline   ");
  lcd.setCursor(0, 221); lcd.print("W        2         4         6         8  In Hours   ");
  lcd.drawFastVLine(0,  88, 112, ILI9341_RED);                    // setup Y axis
  lcd.drawFastHLine(0, 200, 238, ILI9341_RED);                    // setup X axis
  lcd.drawFastHLine(0, 201, 238, ILI9341_RED);                    // setup X axis double-width X axis for emphasis
}
I highly recommend mapping your LCD resources on paper before you start coding:
**************************** ILI9341 320x240 DISPLAY LAYOUT ****************************
0,0
----------------------------------------------------------------------------> 319
| nnnT                                                                 DOW
|              lcd.fillRect( 0,  0, 319, 59, 0);     // blank top
|
|
|<- 059
|
|              lcd.fillRect( 0, 60, 319, 114, 0);     // blank middle
|                              HH:MM:SS A
|
|
|
|<- 174
|              lcd.fillRect( 0, 175, 319, 64, 0);     // blank lower
|
| MON DD YYYY
|
|<- 239
*/

/*
 https://learn.adafruit.com/downloads/pdf/adafruit-gfx-graphics-library.pdf

 **************************** Adafruit_GFX functions ****************************
BP180_GLCD_48.zip (33.3 KB)