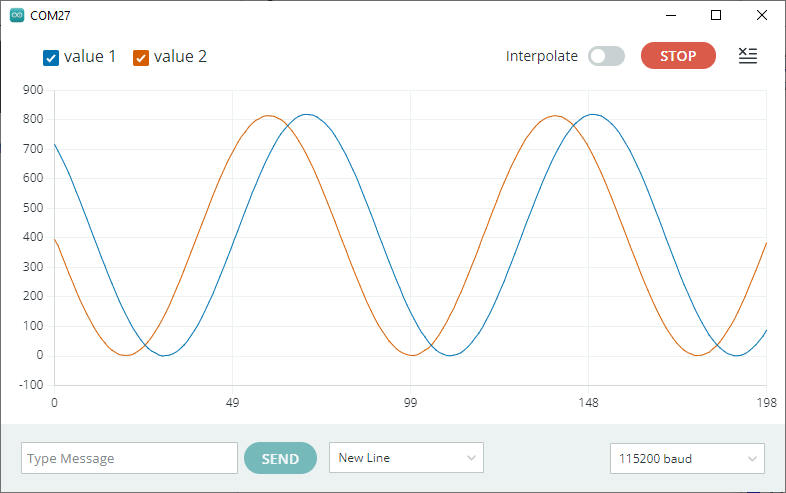
I'm new to Arduino and developing power factor meter and doing calibration before proceeding with my devs.. but I'm getting phase shift at the output (See the attached screenshot)
...
what do you thing the cause of this problem?
I really appreciate your help and thanks in advance
float vAnalogRead;

float iAnalogRead;

int voltageInputPin = A0; // Analog input pin for voltage sensor

int currentInputPin = A1; // Analog input pin for current sensor

int currentOffset =0.; // key in value for current offset setting

int voltageOffset = 0; // key in value for voltage offset setting

float virtualMagnification = 5; // to increase the magnification of current value in display

void setup()

{

Serial.begin(9600);

}

void loop()

{

vAnalogRead = analogRead(voltageInputPin) - 512 + voltageOffset;

iAnalogRead = virtualMagnification*(analogRead(currentInputPin) - 512) + currentOffset;

Serial.print(vAnalogRead);

Serial.print(" ");

Serial.println(iAnalogRead);

delay(100);

}
I'm guessing value1 represents load voltage and value2 represents load current and the phase shift is due to the characteristics of the measuring transformer(s).
P.S. Your posted circuit has the same coloring attributes as the screen background.
2: what effect will a delay of 100msec between samples have on your signal measurements?
remember the nyquist criterion - you need to take AT LEAST TWO samples per period. At 50hz that is a sample every 10msec.
did a few experiments using the UNO reading two ADC channels where time has to be allowed for the ADC to stabilize
in this code timer 1 interrupt runs at .125mSec alternatly sampling the ADCs
// Mega timer1 interrupts reading two ADC channels

#include <TimerOne.h>

const int LED_pin = 13;

volatile unsigned long int count;

#define SAMPLES 500
volatile int data[SAMPLES + 100] = {0};
volatile int data1[SAMPLES + 100] = {0};
volatile int index = 0, index1=0, adcToRead=0, done = 0, i;

// called on timer1 interrupt
void printFunc(void) {
  sei();                          // enable interrupts
  if (index < SAMPLES)   {         // acquire samples ?
  // alternating ADC channels to allow time for ADC to stabilize
    if(adcToRead) data[index++] = analogRead(A1);  // read the A1 input pin
    else          data1[index1++] = analogRead(A5);  // read the A5 input pin
    adcToRead=!adcToRead;
  }
  else {
    if (done == 0) done = 1;
    count++;
  }
}

void setup()
{
  Serial.begin(115200);
  pinMode(LED_pin, OUTPUT);
  digitalWrite(LED_pin, LOW);
  //Initialize timer with .125 mSec second period (.1 does not give ADCs time to stabilize)
  Timer1.initialize(125);
  Timer1.attachInterrupt(printFunc);
  //Serial.print("TIMER1 Setup Finished. reload = ");
}

void loop()
{
  static long start = millis();
  while (done == 0) ; //return;     // if acquisition complete return
  static boolean output = HIGH;
  if (count == 10000) {
    digitalWrite(LED_pin, output);
    count = 0;
    output = !output;
  }
  if (done == 2) return;   // if acquisition complete return
  Timer1.detachInterrupt();
  /* Serial.print("Time for 500 samples ");
  Serial.print(start = millis() - start);
  Serial.print("mSec  ");
  Serial.print(SAMPLES * 1000L / start);
  Serial.println(" Samples per second");
  */
  //for (i = 0; i < SAMPLES; i++) // print samples for plot
  for (i = 0; i < 200; i++) // print samples for plot
  {
    //Serial.print(i); Serial.print(' ');
    Serial.print(data[i]);
    Serial.print('\t');
    Serial.println(data1[i]);
    //delay(10);
  }
  done = 2;
}
two 50Hz signals in phase gave plot of 200 readings
by calibrating for the error when signals are in phase may be able to calculate phase difference
possibly move to an Arduino Due?
Edit: added simple zero crossing detection to calculate period and frequency
  // calculate period and frequency
  int zeroIndex = 0;
  for (i = 0; i < 200; i++) {
    if (signbit(data[i + 1] - 400) != signbit(data[i] - 400)) {
      Serial.print("zero cross ");
      Serial.print(i);
      if (zeroIndex) {
        Serial.print(" Period ");
        Serial.print((i - zeroIndex) * .250 * 2);
        Serial.print(" frequency ");
        Serial.println(1000.0 / ((i - zeroIndex) * .250 * 2));
      }
      zeroIndex = i;
    }
Serial monitor displays
zero cross 7zero cross 47 Period 20.00 frequency 50.00
zero cross 86 Period 19.50 frequency 51.28
zero cross 127 Period 20.50 frequency 48.78
zero cross 166 Period 19.50 frequency 51.28
The next sample comes from part of the waveform 5 cycles later in time.
It is only the fact that that the time it takes until taking the next sample (101.2ms) is not an exact multiple of the signal period (20ms) that the resulting graph looks vaguely sinusoidal.
extended loop() code of post 16 to calculate frequency and phase difference between the two signals
void loop() {
  static long start = millis();
  while (done == 0)
    ;  //return;     // if acquisition complete return
  static boolean output = HIGH;
  if (count == 10000) {
    digitalWrite(LED_pin, output);
    count = 0;
    output = !output;
  }
  if (done == 2) return;  // if acquisition complete return
  Timer1.detachInterrupt();
  /* Serial.print("Time for 500 samples ");
  Serial.print(start = millis() - start);
  Serial.print("mSec  ");
  Serial.print(SAMPLES * 1000L / start);
  Serial.println(" Samples per second");
  */
  //for (i = 0; i < SAMPLES; i++) // print samples for plot
  for (i = 0; i < 200; i++)  // print samples for plot
  {
    //Serial.print(i); Serial.print(' ');
    Serial.print(data[i]);
    Serial.print('\t');
    Serial.println(data1[i]);
    //delay(10);
  }
  // calculate period and frequency
  int zeroIndex = 0, zeroAverage = 0, counter = 0;
  float freqAverage = 0.0, phaseAverage = 0.0;
  ;
  for (i = 0; i < SAMPLES; i++) {
    if (signbit(data[i + 1] - 400) != signbit(data[i] - 400)) {
      Serial.print("zero cross ");
      Serial.print(i);
      if (zeroIndex) {
        zeroAverage += (i - zeroIndex);
        counter++;
        Serial.print(" Period ");
        Serial.print((i - zeroIndex) * .250 * 2);
        Serial.print(" frequency ");
        Serial.println(1000.0 / ((i - zeroIndex) * .250 * 2));
        freqAverage += (1000.0 / ((i - zeroIndex) * .250 * 2));
      }
      zeroIndex = i;
    }
  }
  zeroAverage /= counter;
  Serial.print("zeroAverage ");
  Serial.println(zeroAverage);
  Serial.print("average frequency ");
  Serial.println(freqAverage / counter);
  counter = 0;
  for (i = 0; i < SAMPLES; i++) {
    if (signbit(data[i + 1] - 400) != signbit(data[i] - 400)) {
      Serial.print("data zero cross ");
      Serial.print(i);
      zeroIndex = i;
    }
    if (signbit(data1[i + 1] - 400) != signbit(data1[i] - 400)) {
      Serial.print(" data1 zero cross ");
      Serial.print(i);
      if (zeroIndex) {
        Serial.print(" phase ");
        Serial.print(i - zeroIndex);
        Serial.print(" ");
        Serial.println(180 * float(i - zeroIndex) / zeroAverage);
        phaseAverage += (180 * float(i - zeroIndex) / zeroAverage);
        counter++;
        //Serial.println(1000.0 / ((i - zeroIndex) * .250 * 2));
      }
      zeroIndex = i;
    }
  }
  Serial.print("\naverage phase ");
  Serial.println(phaseAverage / counter);
  done = 2;
}
a run with the signals in phase
zero cross 16zero cross 55 Period 19.50 frequency 51.28
zero cross 96 Period 20.50 frequency 48.78
zero cross 135 Period 19.50 frequency 51.28
zero cross 175 Period 20.00 frequency 50.00
zero cross 214 Period 19.50 frequency 51.28
zero cross 255 Period 20.50 frequency 48.78
zero cross 294 Period 19.50 frequency 51.28
zero cross 333 Period 19.50 frequency 51.28
zero cross 372 Period 19.50 frequency 51.28
zero cross 412 Period 20.00 frequency 50.00
zero cross 452 Period 20.00 frequency 50.00
zero cross 492 Period 20.00 frequency 50.00
zeroAverage 39
average frequency 50.44
data zero cross 16 data1 zero cross 18 phase 2 9.23
data zero cross 55 data1 zero cross 58 phase 3 13.85
data zero cross 96 data1 zero cross 98 phase 2 9.23
data zero cross 135 data1 zero cross 137 phase 2 9.23
data zero cross 175 data1 zero cross 177 phase 2 9.23
data zero cross 214 data1 zero cross 217 phase 3 13.85
data zero cross 255 data1 zero cross 257 phase 2 9.23
data zero cross 294 data1 zero cross 296 phase 2 9.23
data zero cross 333 data1 zero cross 337 phase 4 18.46
data zero cross 372 data1 zero cross 377 phase 5 23.08
data zero cross 412 data1 zero cross 417 phase 5 23.08
data zero cross 452 data1 zero cross 456 phase 4 18.46
data zero cross 492 data1 zero cross 496 phase 4 18.46

average phase 14.20
error due to alternating ADC channel reading on sucessive interrupts
a run with signal 60degrees out of phase
zero cross 29zero cross 68 Period 19.50 frequency 51.28
zero cross 108 Period 20.00 frequency 50.00
zero cross 147 Period 19.50 frequency 51.28
zero cross 188 Period 20.50 frequency 48.78
zero cross 227 Period 19.50 frequency 51.28
zero cross 267 Period 20.00 frequency 50.00
zero cross 306 Period 19.50 frequency 51.28
zero cross 345 Period 19.50 frequency 51.28
zero cross 385 Period 20.00 frequency 50.00
zero cross 425 Period 20.00 frequency 50.00
zero cross 465 Period 20.00 frequency 50.00
zero cross 499 Period 17.00 frequency 58.82
zeroAverage 39
average frequency 51.17
 data1 zero cross 4data zero cross 29 data1 zero cross 44 phase 15 69.23
data zero cross 68 data1 zero cross 83 phase 15 69.23
data zero cross 108 data1 zero cross 124 phase 16 73.85
data zero cross 147 data1 zero cross 163 phase 16 73.85
data zero cross 188 data1 zero cross 203 phase 15 69.23
data zero cross 227 data1 zero cross 242 phase 15 69.23
data zero cross 267 data1 zero cross 283 phase 16 73.85
data zero cross 306 data1 zero cross 322 phase 16 73.85
data zero cross 345 data1 zero cross 363 phase 18 83.08
data zero cross 385 data1 zero cross 402 phase 17 78.46
data zero cross 425 data1 zero cross 442 phase 17 78.46
data zero cross 465 data1 zero cross 481 phase 16 73.85
data zero cross 499
average phase 73.85
if the in phase error is subtracted the result 73.85-14.20=59.65
clearly the algorithms used the determine the frequency and phase are very simple, e.g. if the signals are 180degrees out of phase the algorith returns 0degrees
a system with a faster ADC or even two external ADCs which can acquire the two signals simultaneously would reduce errors
also improved algorithms for calculating frequency and phase would be required