Hello guys, I don’t know whether this fits here or not. I made two different Programms, one which measures the magnetic field with a sensor and another one measured the current.
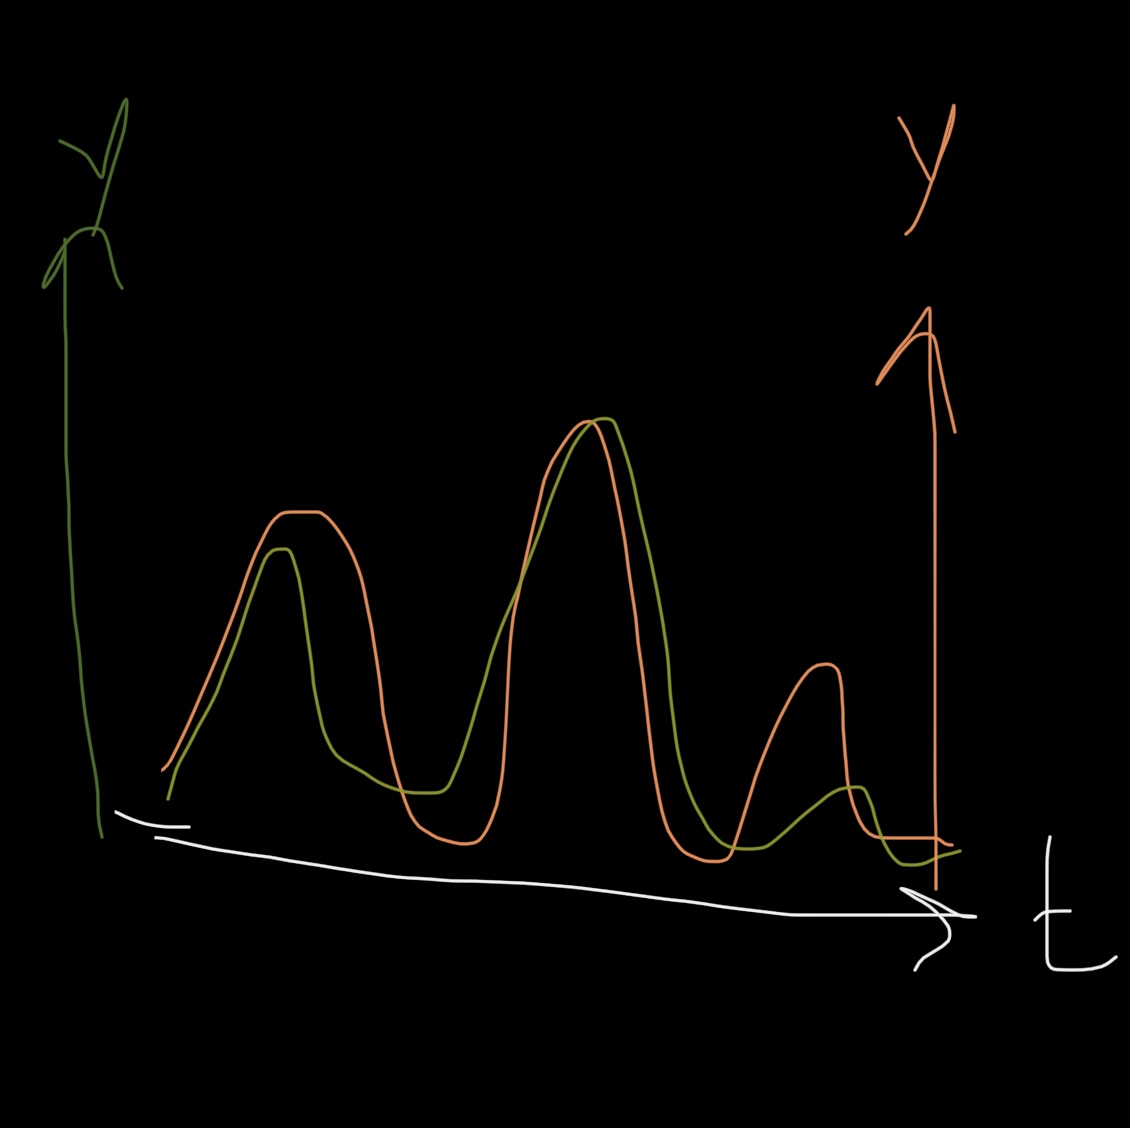
I want to plot both of the signals in one graph with different y- axis and one time axis in seconds, maybe with matlab or excel. So it looks like this
How could I possibly do that? For example I make a measurement for 1 min on the first Programm and copy the measurements and put it in a variable in matlab and then make another messurement with the other Programm for one minute and do the same. But how do I plot them with the same x time axis?
where measureN() are the functions to perform the measure and export() is the function that will send the result out to whatever you decided to export to
then it's a matter of creating the plot in the software you picked (excel, matlab, ...)