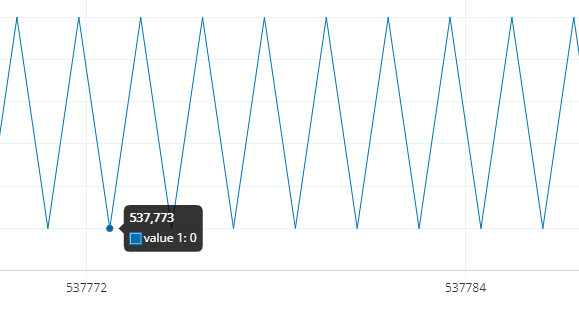
With the sketch below, why are there so many points on the X scale between every Serial.println number ) ; ??
This makes the Serial Plotter almost useless for me.
Am i missing a setting ??
int number =0;

void setup() {
  // put your setup code here, to run once:
  Serial.begin( 9600 );

}

void loop() {
  // put your main code here, to run repeatedly:
  if( number ) {
    number = 0;
  } else {
    number = 100 ;
  }
  Serial.println( number );
}
Looks like both the y-axis and x-axis is auto scaled (normalized). If so, that's actually a nice feature! I've been holding off on using 2.1, but i think its time to give it a run.
Hi @vroemm. The Arduino IDE developers are tracking this request here:
If you have a GitHub account, you can subscribe to that issue to get notifications of any new developments related to this subject.
The discussion linked above does contain a hack for changing the number of data points, but it is a fairly advanced endeavor and something that would need to be repeated every time you update to a new version of Arduino IDE.
I consider the auto scaling of plot width a valuable feature because it automatically zooms in to full width for the available data, then it becomes a sliding -window. The interpolate (spline) option for connecting the data points is a really nice new feature.
As it stands now, the plot width auto scales to full width as the data fills to 50 samples, then the plotter becomes a sliding window.
Perhaps an improvement would be to have the plot width auto scale to full width as the data fills to 500 samples (or a user set limit), then the sliding window activates.
I'll add a suggestion to the GitHub link provided. (thanks)
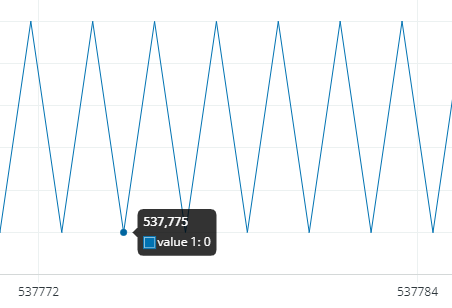
Same code, 100 samples shown on plotter using Arduino IDE 1.8.19 ...
Yep, there is the problem, only 50 real data points on the x axis.
It feels good to be understood
A user set limit, a user set limit, yes please :-))
I would go for the possibility to set the x axis to even more then the number of pixels on the x axis.
Then one pixel on the x axis could have more then one data point on the y axis.
Just in case it is useful some day
Thank you very much..
The chart of this code is much more understandable on arduino 1.8.x compared to 2.x
float number =1;
bool up = true;

void setup() {
  // put your setup code here, to run once:
  Serial.begin( 115200 );

}

void loop() {
  // put your main code here, to run repeatedly:

  if( number > 100 ) up = false;
  if ( number < 1) up = true;

  if( up ) {
    number = number * 1.05;
  } else {
    number = number / 1.05;
  }

  Serial.println( number );
  delay(10);
}
Yes, this would be handy. It could be done now within your code (but not as convenient) ... just skip every nth data point. This works fine if you're plotting slow responding signals. like a thermal heater with pid control.
For example, below is an image where I've plot every 6th datapoint from a dataset of about 2000 readings taken at 1 reading per sec. Now the resulting plot fits within the 500 sample range (using IDE 1.8..19) and also makes the x value represent time (0-500 representing 0-5 minutes). This also represents 0-3000 samples. The "6X compressed" graph still looks OK ...
Well, if you had 2000 data-points and only 500 pixels to display them, instead of skipping, could just average 4 readings at a time, every 4 reading average gets plotted.
The serial plot window has a x width number of pixels.
Use this number as the number of data points. ( Minus some room for the Y scale numbers ).
And add the user option to make the distance between data points 1,2,3,4,5,6,7,8,9 or 10 pixels on the x axis.
This way you can see each data point more independent.
And add the user option to place 1,2,3,4,5,6,7,8,9 or 10 data points on one X pixel.
To compress long processes and still see the data.
Simply use all pixels on the x axis for data points.
One pixel = one data point.
And add 10 times zoom in, 10 times zoom out.