Thanks... but doesn't work for me.
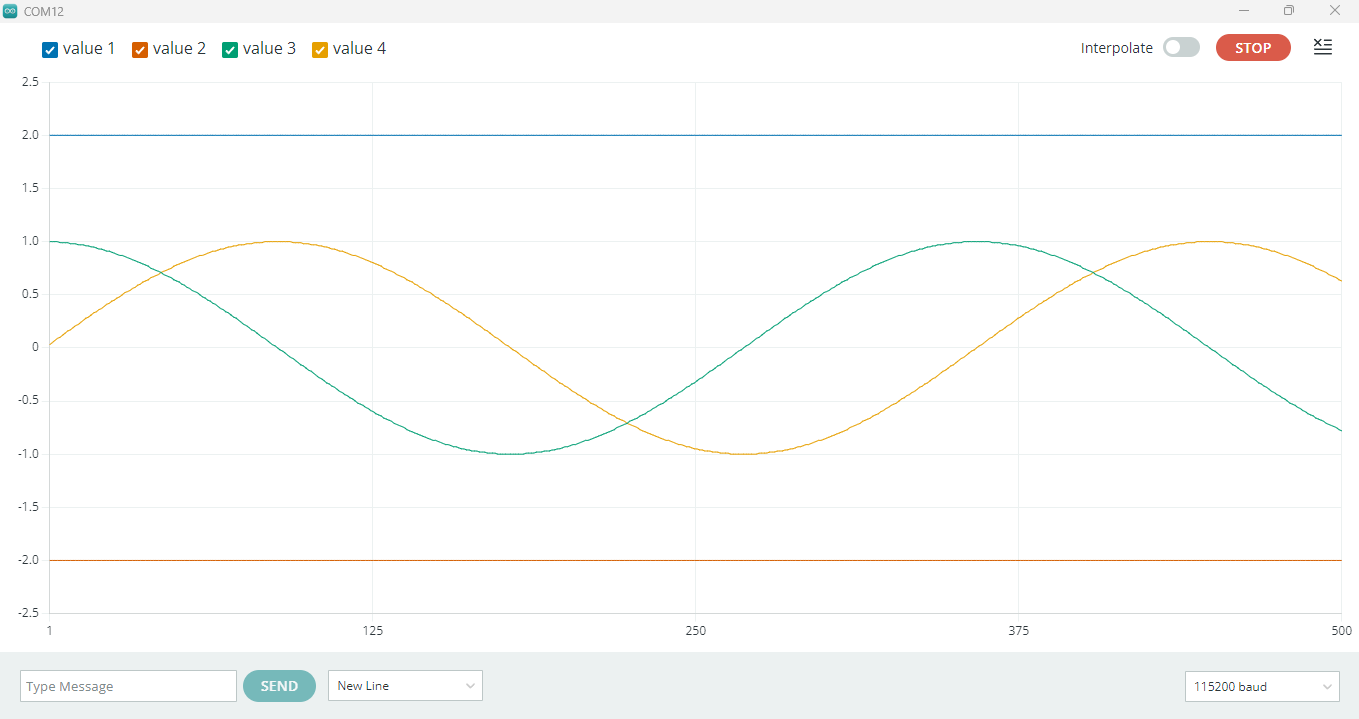
I am not getting a single complete curve.
With 5ms I get more data, but the plot is still 5 points on the x-Axis.
How can I see, say 50 or a 100 points on X?
I'm sorry, the Wokwi serial plotter works in time so the results are different.
The IDE serial plotter works in points, and only has a window of a 50 of points. If you want to show a waveform in 50 points, you need to skip further than i++ for each point.
Your number of sample points is too high, right now you are using 360 sample points. reduce it and you can reduce the horizontal scaling. for eg instead of i++ , use i+20. Image below shows the result.
On version 2.x.x of the IDE, the serial plotter is a web application that is installed as part of the Arduino IDE, since it's running as a web application, bundled source code can be modified on a local machine.
The package can be found in the installation folder of the Arduino IDE:
This file can be edited to change the number of points plotted.
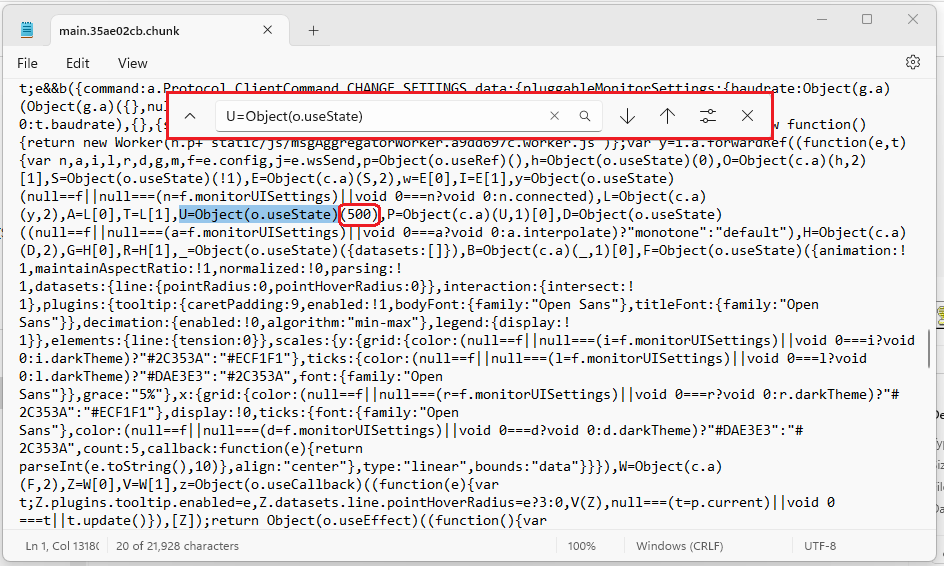
You need to edit the line:
U=Object(o.useState)(50)
and change it to:
U=Object(o.useState)(500)
Using Notepad, or Notepad++ just search for 'U=Object(o.useState)', and change the (50) to (500) , or whatever you choose.
You can always change it back if you want to.
I see the fact that the default number is 50 rather than 5 as you originally thought was already clarified earlier in the thread. For those who would like to have more than 50, I'll mention here that the Arduino IDE developers are tracking the request here:
If you have a GitHub account, you can subscribe to that thread to get notifications of any new developments related to this subject: