I am trying to learn how to use the Serial Plotter and used the following sketch:
int i=0;
float ySin;
float yCos;

void setup() {
Serial.begin(9600);
Serial.print("Sin:0, ");
Serial.print("Cos:0, ");
delay(200);
}

void loop() {
ySin=220*sin((PI/180.0)*i);
yCos=220*cos((PI/180.0)*i);
Serial.print(ySin);
Serial.print(" ");
Serial.println(yCos);
delay(1);
i++;
}
This gave the following output:
I wanted to show Sin & Cos instead of value 1 & value 2 and after a bit of investigation changed the sketch to the following:
int i=0;
float ySin;
float yCos;

void setup() {
Serial.begin(9600);
delay(200);
}

void loop() {
Serial.print("Sin:0, ");
Serial.print("Cos:0, ");
ySin=220*sin((PI/180.0)*i);
yCos=220*cos((PI/180.0)*i);
Serial.print(ySin);
Serial.print(" ");
Serial.println(yCos);
delay(1);
i++;

}
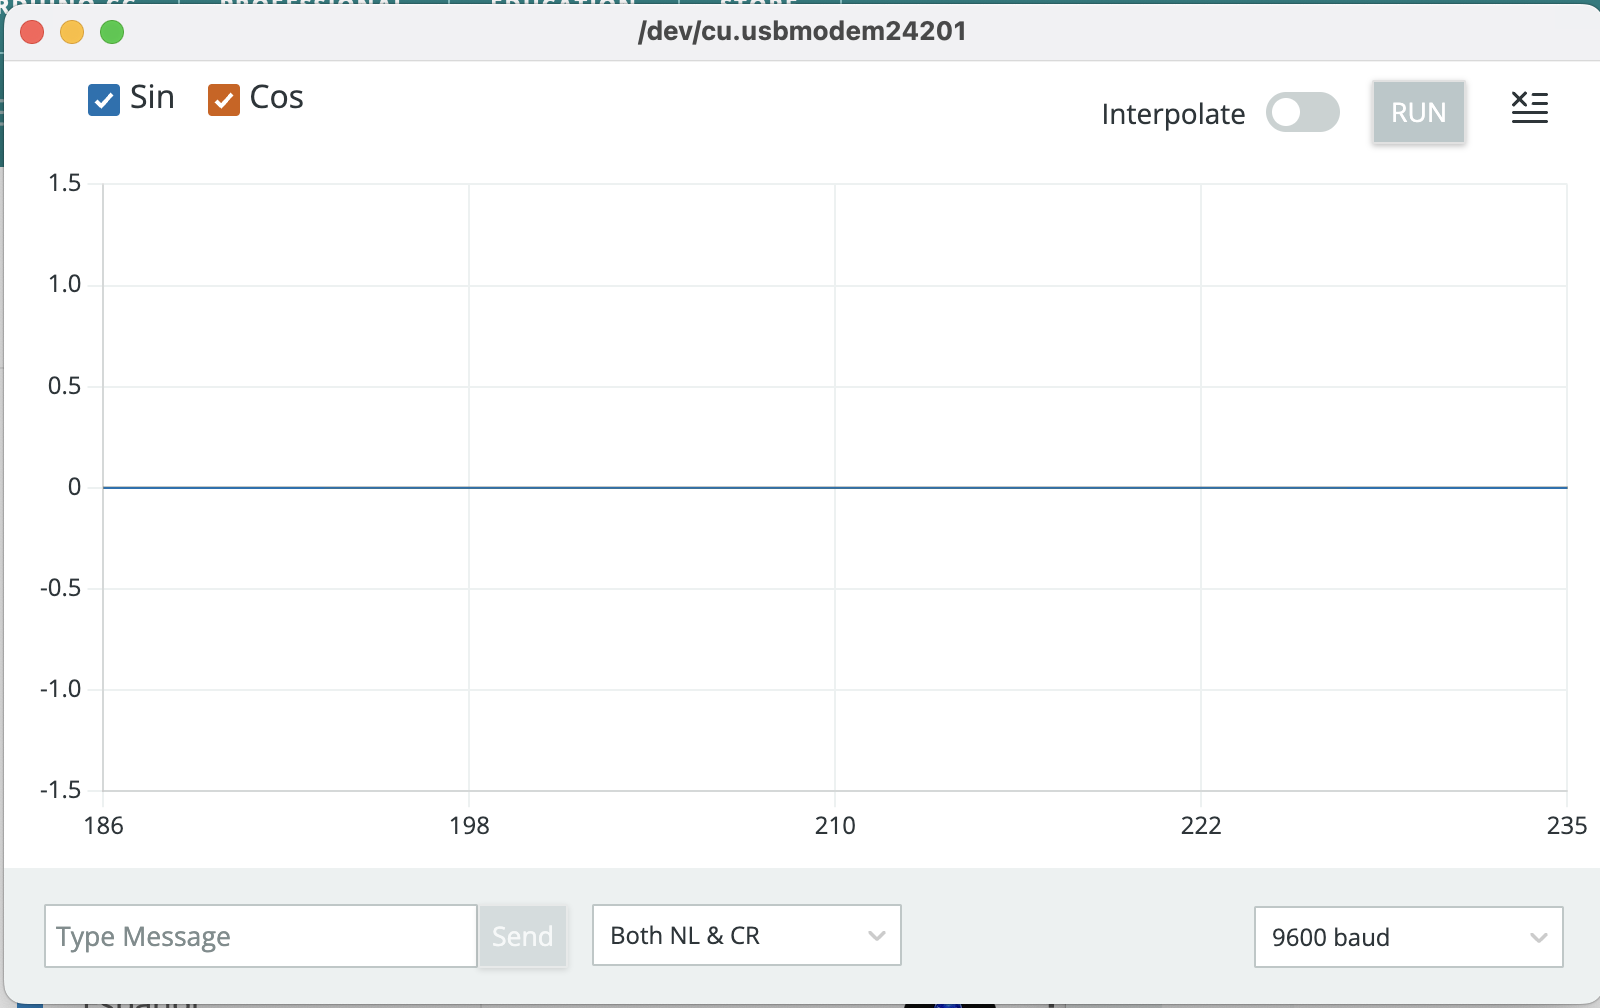
This was the output:
Labels are fine but plot is just a flatline!
Any pointers on my mistakes would be much appreciated.
Also would it be possible to stop the Y axis from moving?
One more question: is it possible to show a whole sin wave/cosine wave in the window?
Hi @SierraGolfMike . The data format understood by the plotter has the following format:
<label>:value<delimiter><label>:value
You are producing data with the following format:
Sin:0, Cos:0, 42 123
The plotter is not able to parse this data.
The equivalent to your first sketch, but with labels would be:
  ySin = 220 * sin((PI / 180.0) * i);
  yCos = 220 * cos((PI / 180.0) * i);
  Serial.print("Sin:");
  Serial.print(ySin);
  Serial.print(" ");
  Serial.print("Cos:");
  Serial.println(yCos);
You can prevent the auto-scaling by adding additional variables with constant values set to the Y axis scale you want:
int i = 0;
float ySin;
float yCos;

void setup() {
  Serial.begin(9600);
  delay(200);
}

void loop() {
  Serial.print("_:-250 __:250 "); // Prevent change to Y axis scale by plotter's auto-scaling feature.
  ySin = 220 * sin((PI / 180.0) * i);
  yCos = 220 * cos((PI / 180.0) * i);
  Serial.print("Sin:");
  Serial.print(ySin);
  Serial.print(" ");
  Serial.print("Cos:");
  Serial.println(yCos);
  delay(1);
  i++;
}
The Arduino IDE developers are tracking the request for a built-in option to disable auto-scaling here:
opened 05:31AM - 05 Feb 16 UTC
type: enhancement
topic: code
With values that constantly change, the range of the plot will shrink and expand… , making it incredibly difficult to judge the amplitude of a plot without constantly re-checking the Y-axis (of which is too small to read on my 4K screen anyway). A 3 inch peak may have a max value of 500, and 10 seconds later, another 3 inch peak will have a value of 25!
By having a selectable minimum and maximum, each peak on the plot can be visually compared properly.
There is no easy way to configure the number of data points visible in the plotter:
opened 07:47PM - 02 Feb 22 UTC
type: enhancement
topic: code
### Describe the request
Change the number of plot values back to 500. Or mak… e it a user selectable option
### Describe the current behavior
The Arduino IDE 2.x Serial Plotter displays only 50 data values, compared to the Arduino IDE 1.x plotter, which displayed 500 values.
This is a problem because events stream by 10 times faster and are much harder to see. With 500 points we see a much clearer time history of the physical measurements we're making.
I use the Plotter a lot in my K-12 STEM workshops, and this will really have a negative impact.
### Arduino IDE version
51f69f6a5930ed1c947ac708b2d7280ea3e0cd57
### Operating system
All
### Operating system version
Any
### Additional context
#### Additional requests
- https://github.com/arduino/arduino-ide/issues/1308
- https://github.com/arduino/arduino-serial-plotter-webapp/pull/32#issuecomment-1702745688
- https://github.com/arduino/arduino-serial-plotter-webapp/pull/32#issuecomment-1819911002
- https://github.com/arduino/arduino-serial-plotter-webapp/pull/32#issuecomment-1915065796
- https://forum.arduino.cc/t/serial-plotter-very-fast-in-adruino-2-1/1123294
- https://forum.arduino.cc/t/plotter-with-more-samples-in-the-window/1034998
- https://forum.arduino.cc/t/how-can-i-change-the-amount-of-data-displayed-in-the-serial-plotter-window/1043750/1
- https://forum.arduino.cc/t/how-can-i-change-the-amount-of-data-displayed-in-the-serial-plotter-window/1043750/18
- https://forum.arduino.cc/t/serial-plotters-horizontal-scale/1014334
- https://forum.arduino.cc/t/serial-plotter-x-axis-too-limited/1172318
- https://forum.arduino.cc/t/your-reason-for-not-switching-to-the-2-x-ide/1176322/10
- https://forum.arduino.cc/t/serial-plotter-output-too-fast/1233965
### Issue checklist
- [X] I searched for previous requests in [the issue tracker](https://github.com/arduino/arduino-ide/issues?q=)
- [X] I verified the feature was still missing when using the latest [nightly build](https://www.arduino.cc/en/software#nightly-builds)
- [X] My request contains all necessary details
You could adjust your code so that the wave is represented by only 50 data points.
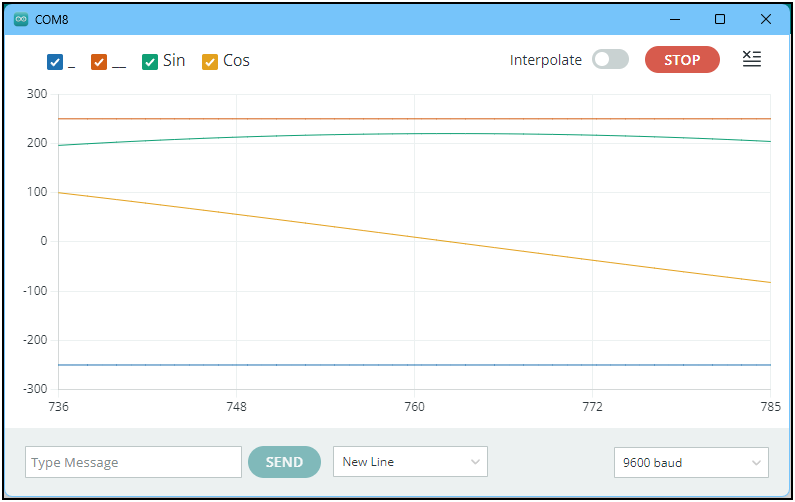
Many thanks for your reply, I have taken your advice and my altered code as shown below. However it only shows the Sin value and plot! I can’t see anything I have missed. I will look at your other points once I get this bit working. I am using IDE 2.0.0 if that makes any difference.
int i=0;
float ySin;
float yCos;

void setup() {
Serial.begin(9600);
delay(200);
}

void loop() {
ySin=220*sin((PI/180.0)*i);
yCos=220*cos((PI/180.0)*i);
Serial.print("Sin:");
Serial.print(ySin);
Serial.print(" ");
Serial.print("Cos:");
Serial.println(yCos);
delay(1);
i++;

}
See below:
That sounds like a good option, I will give it a go once I get my main issue sorted. Thank you
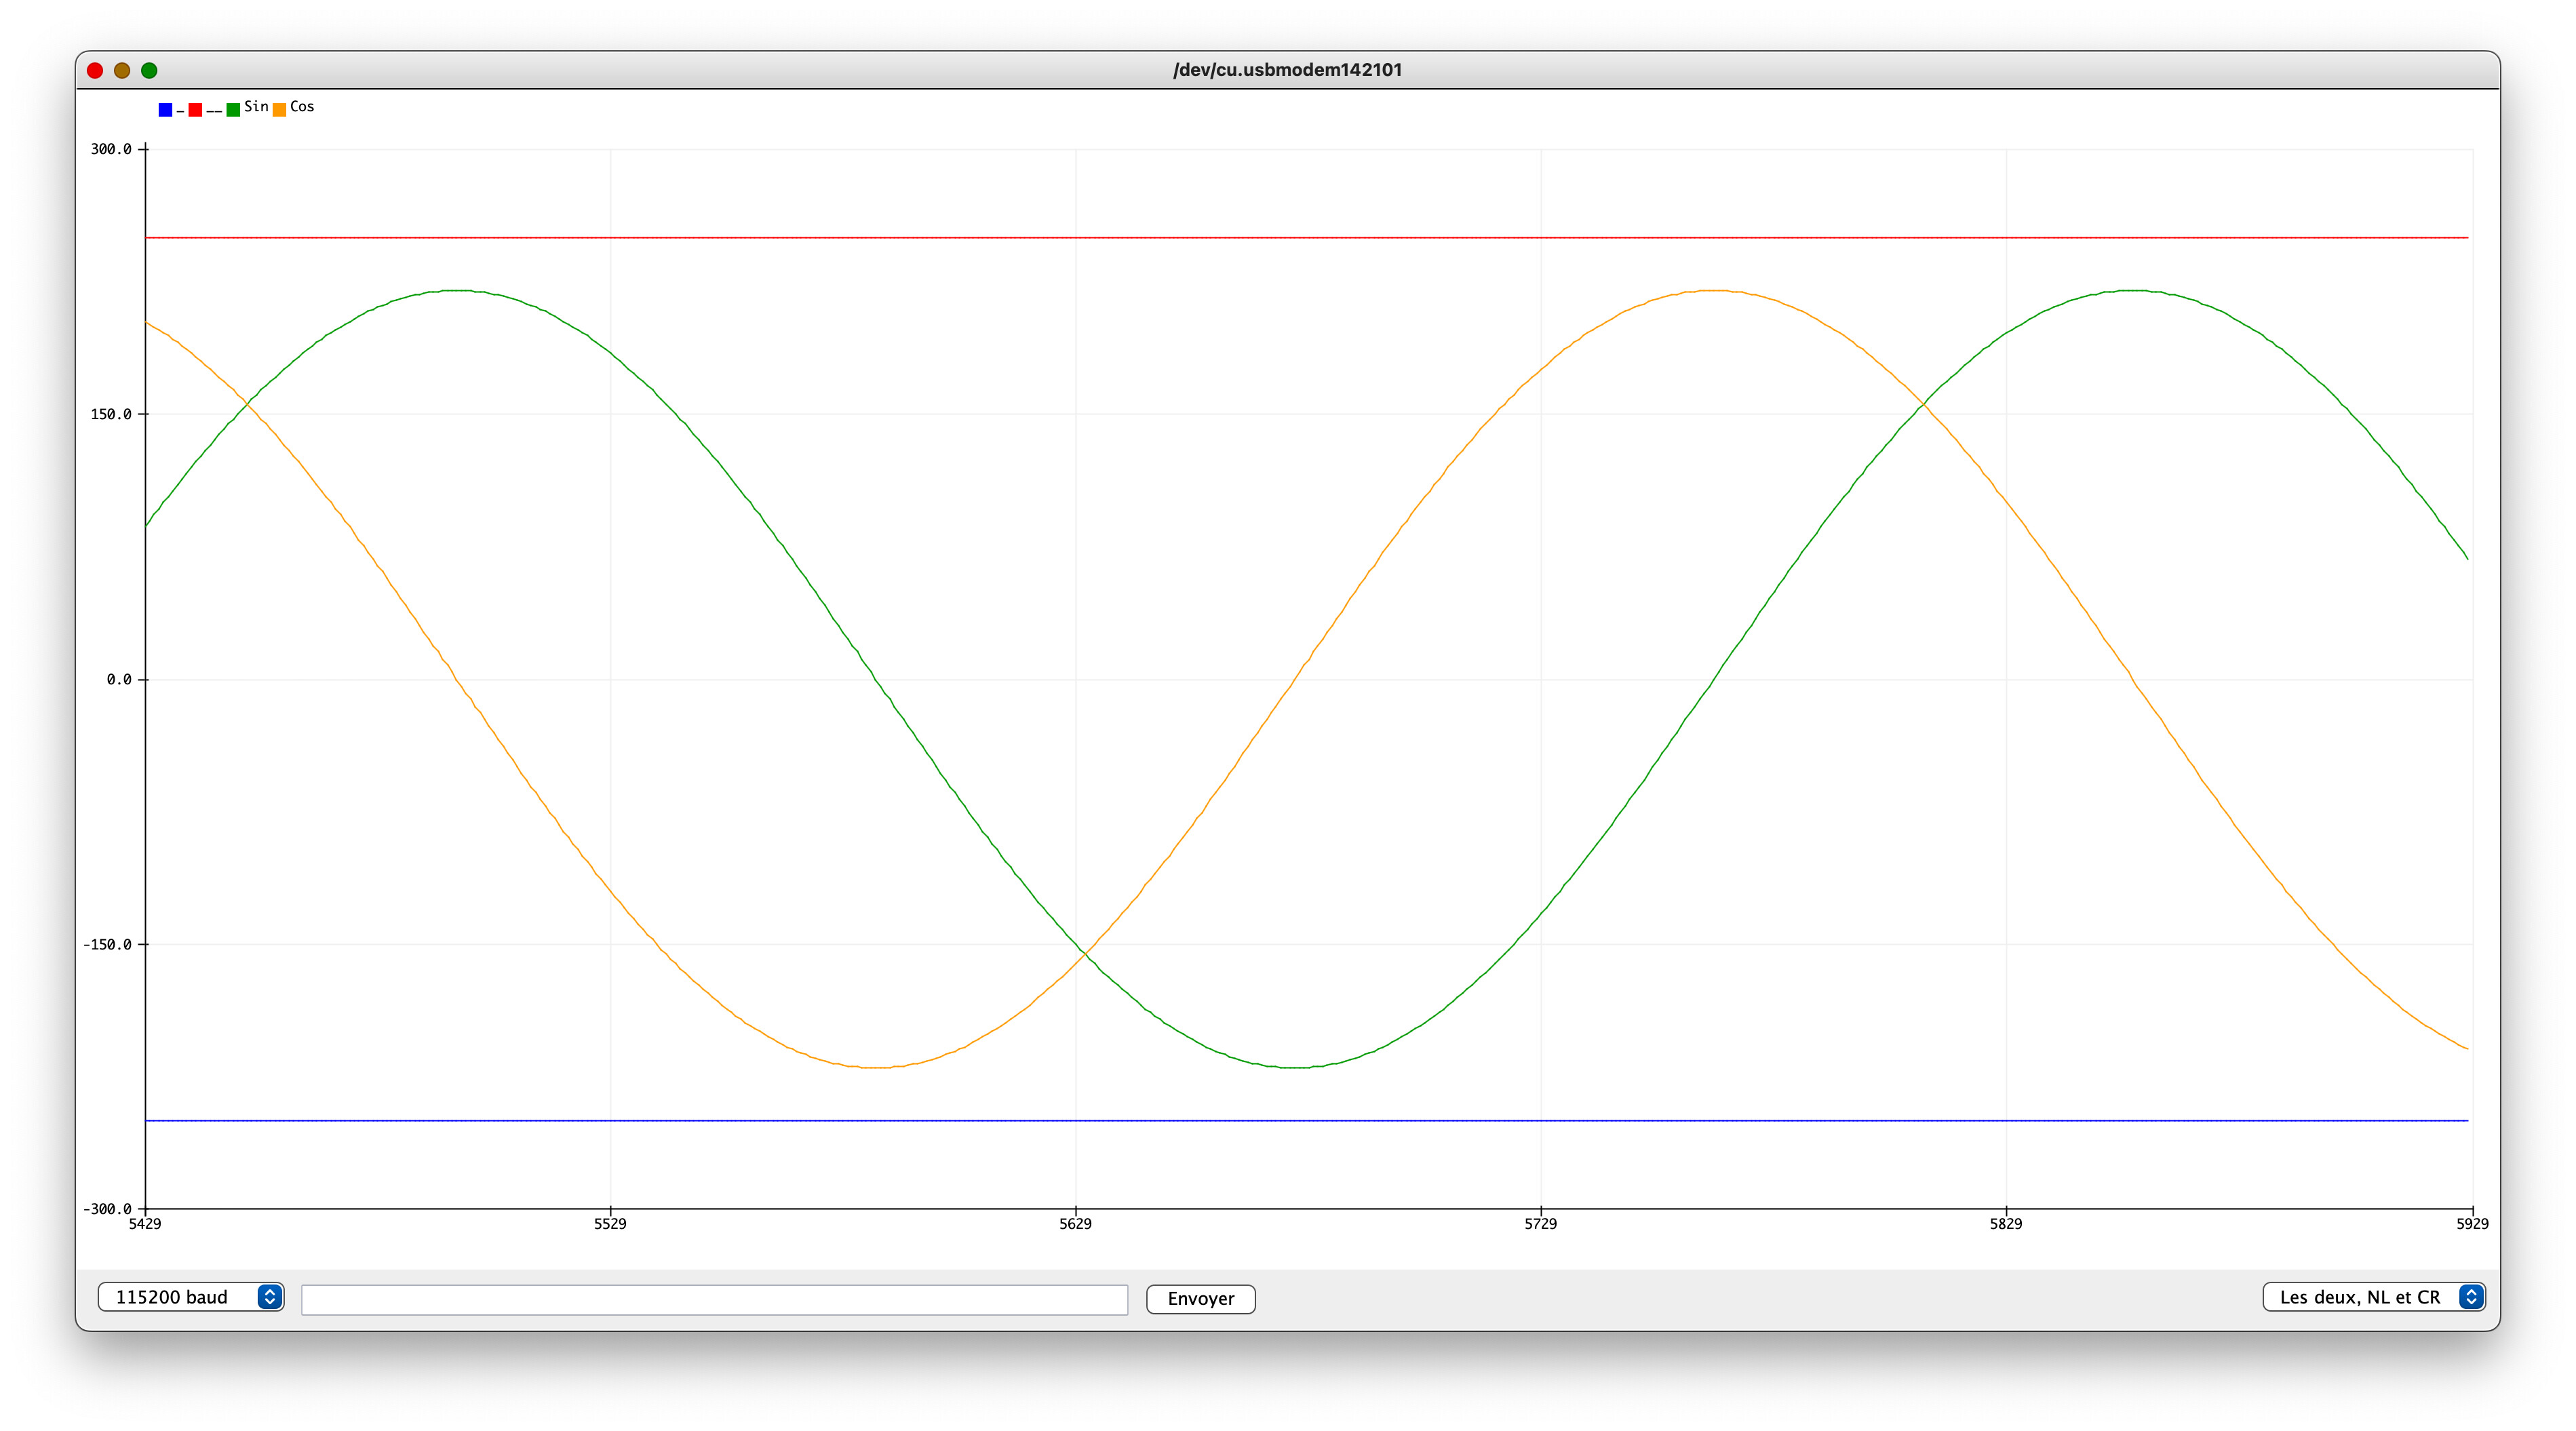
I'm not able to reproduce the fault. The sketch you provided works as expected for me:
I was able to infer that fact from your screenshots. However, it is indeed relevant in regards to your question:
Arduino IDE 1.x Serial Plotter shows 500 data points as compared to Arduino IDE 2.x's 50, so would be better suited to displaying the full wave.
J-M-L
September 16, 2025, 11:37am
6
@UKHeliBob found this recently
this seems way more capable than the built in plotter.
As a side note, I don't understand who as an engineer could make such a limiting decision... It seems so useless...
I tried using this sketch and the result is a flatline with no labels! What IDE version are you using, there would appear to be an anomaly with 2.0.0
It works as expected for me:
2.3.6
Are you really using version 2.0.0, or are you using that as an inaccurate shorthand to refer to the the Arduino IDE 2.x version series in general. I ask because the Arduino IDE 2.0.0 release is seriously outdated and many improvements and bug fixes have been made to the IDE since that release.
J-M-L
September 16, 2025, 11:55am
9
The serial plotter's window with your code in IDE 1.8.19
(I only changed the Serial baud rate to 115200 because 9600 is so old school).
1 Like
There is a way of changing the IDE 2.x.x Serial plotter to display 500 points like the IDE version 1.x.x does.#9 .)
Details are shown how to do it at: https://forum.arduino.cc/t/serial-plotter-output-too-fast/1233965/9 .
I don't claim to be the originator of this information, the original work is by Alex-Tsyganok .
Yes was using IDE 2.0.0, however I have just tried the sketch on a laptop with IDE 2.3.5 and it works as you described. Many thanks for your help.
That output looks much better, hopefully the developers will address the issue in a future update.
You are welcome. I'm glad it is working with 2.3.5!
Is there a specific reason why you are using 2.0.0? I know that some users are not able to update all the way to the latest version due to a loss of compatibility with some obsolete operating systems, but I'm not aware of any such limitation that would force using 2.0.0 specifically.
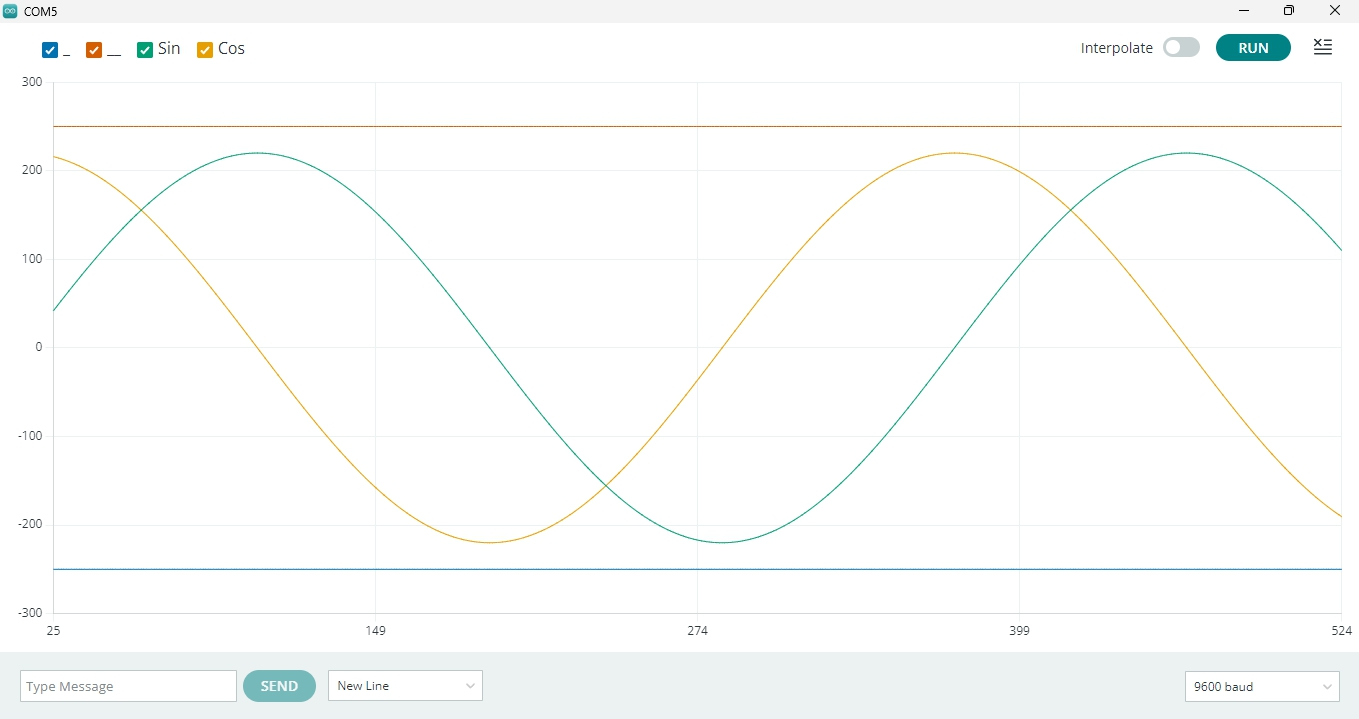
Here's the IDE 2.3.6 Serial Monitor modified to show 500 points, as mentioned in post #10:
You could even adjust it to plot 360 points if you wanted to display exactly one full cycle.
I believe the reason the sketch did not work with Arduino IDE 2.0.0 was because the developer of Serial Plotter did not provide compliance with all ssupported delimiters](Arduino/build/shared/ArduinoSerialPlotterProtocol.md at master · arduino/Arduino · GitHub ) when using labeled data sets. At the time of 2.0.0, the only delimiter supported under these conditions was the comma.
So you could probably make it work with 2.0.0 using this sketch:
int i = 0;
float ySin;
float yCos;

void setup() {
  Serial.begin(9600);
  delay(200);
}

void loop() {
  Serial.print("_:-250 __:250 "); // Prevent change to Y axis scale by plotter's auto-scaling feature.
  ySin = 220 * sin((PI / 180.0) * i);
  yCos = 220 * cos((PI / 180.0) * i);
  Serial.print("Sin:");
  Serial.print(ySin);
  Serial.print(",");
  Serial.print("Cos:");
  Serial.println(yCos);
  delay(1);
  i++;
}
(note the Serial.print(",");)
Compliance with the Arduino Serial Plotter protocol specification was introduced later:
main ← nmzaheer:main
opened 05:31PM - 06 Sep 22 UTC
Part separator symbols as per SerialPlotter protocol i.e. Comma Space and Tab ch… aracters have been added.
This resolves #15
Please review and verify.
and that version of Serial Plotter was used starting with Arduino IDE 2.0.1:
main ← per1234:bump-plotter
opened 10:30AM - 03 Oct 22 UTC
### Motivation
A new version of the arduino-serial-plotter-webapp dependency … is available.
### Change description
Bump arduino-serial-plotter-webapp dependency to 0.2.0
### Other information
Fixes https://github.com/arduino/arduino-ide/issues/1360
### Reviewer checklist
* [ ] PR addresses a single concern.
* [ ] The PR has no duplicates (please search among the [Pull Requests](https://github.com/arduino/arduino-ide/pulls) before creating one)
* [ ] PR title and description are properly filled.
* [ ] Docs have been added / updated (for bug fixes / features)
I updated to IDE 2.3.6 before seeing this post and it is working fine now. Thanks
That’s exactly what I was thinking, struggling to find the file on my Mac though. Thanks for your input.
Followed the instructions and it works a treat. Many thanks!
1 Like
Glad you managed to find it.
I keep a copy of the instructions in a handy place.